FIGURE 2.

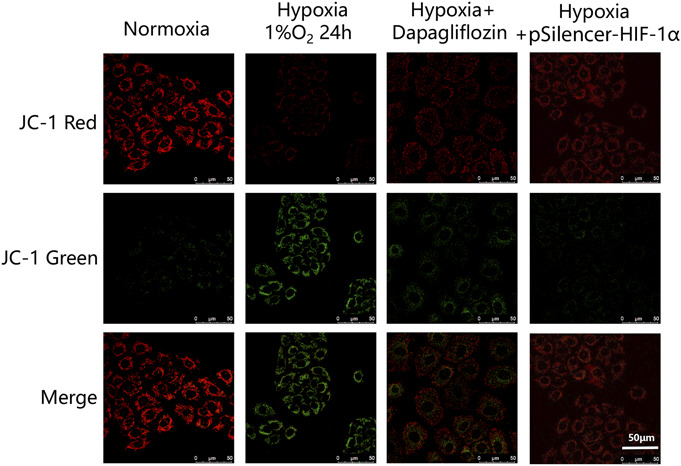
Immunofluorescence analysis of the mitochondrial membrane potential shows that the ratio of JC-1 green increased in the hypoxia group and decreased with dapagliflozin pretreatment (50 μm for all groups). n = 5 in each group.

Immunofluorescence analysis of the mitochondrial membrane potential shows that the ratio of JC-1 green increased in the hypoxia group and decreased with dapagliflozin pretreatment (50 μm for all groups). n = 5 in each group.