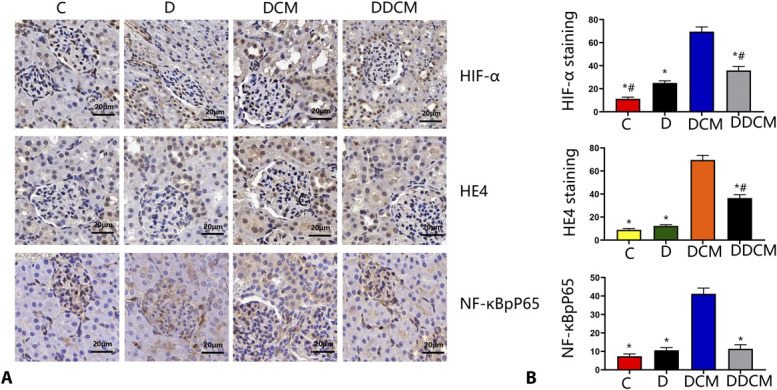
FIGURE 8.

A, Immunohistochemical staining and semiquantitative analysis of HIF-1α, HE4, and NF-κBpP65 in the kidneys of different groups. B, Quantitative analysis of HIF-1α, HE4, and NF-κBpP65. SD rats were treated with or without dapagliflozin for 3 days. Immunohistochemical staining for these proteins (original magnification ×400. Compared with control, proteins significantly increased in the CIN but decreased in the dapagliflozin groups, *P < 0:05 vs. the DCM group; #P < 0:05 vs. the D group. n = 5 in each group). C, control group; D, diabetic rats.
