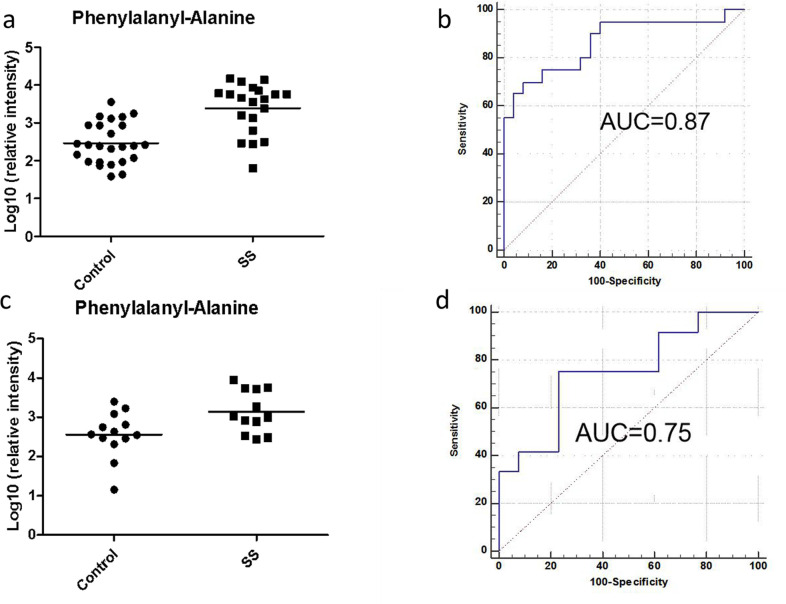
Fig 5. Potential biomarker using phenylalanyl-alanine for pSS prediction from healthy controls.
(a) Relative intensity of metabolites in pSS patients and controls (test group). (b) ROC curve established using logistic regression (test group). (c) Relative intensity of metabolites in pSS patients and controls (validation group). (d) ROC curve in pSS patients and controls (validation group).

