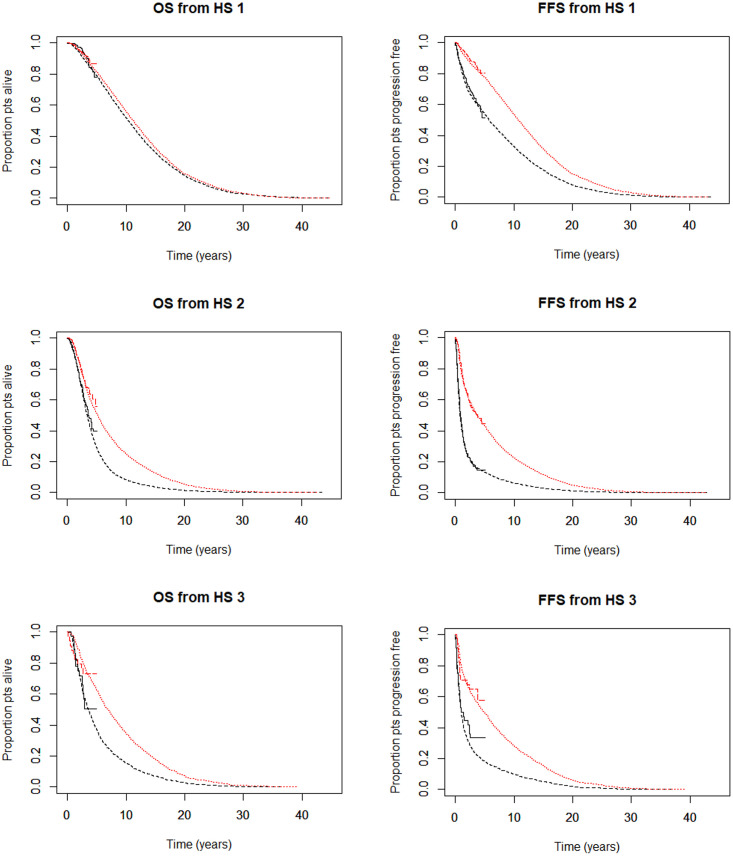
Fig 2. Overall and failure-free survival from each of the three starting health states.
Top row: Overall (OS) and failure-free survival (FFS) from HS1, i.e. the M0 subgroup; middle row: OS and FFS from HS2, i.e. M1 patients whose initial metastasis was in bone; bottom row: OS and FFS from HS3, i.e. M1 patients whose initial metastasis was in visceral tissue (not bone). Stepped lines to around 5 years are observed trial data and smooth lines to 45 years are predicted data from the lifetime simulation model. In the lifetime lines, short dashes (red) indicate the AAP+SOC arm, and longer dashes (black) indicate the SOC-only arm.

