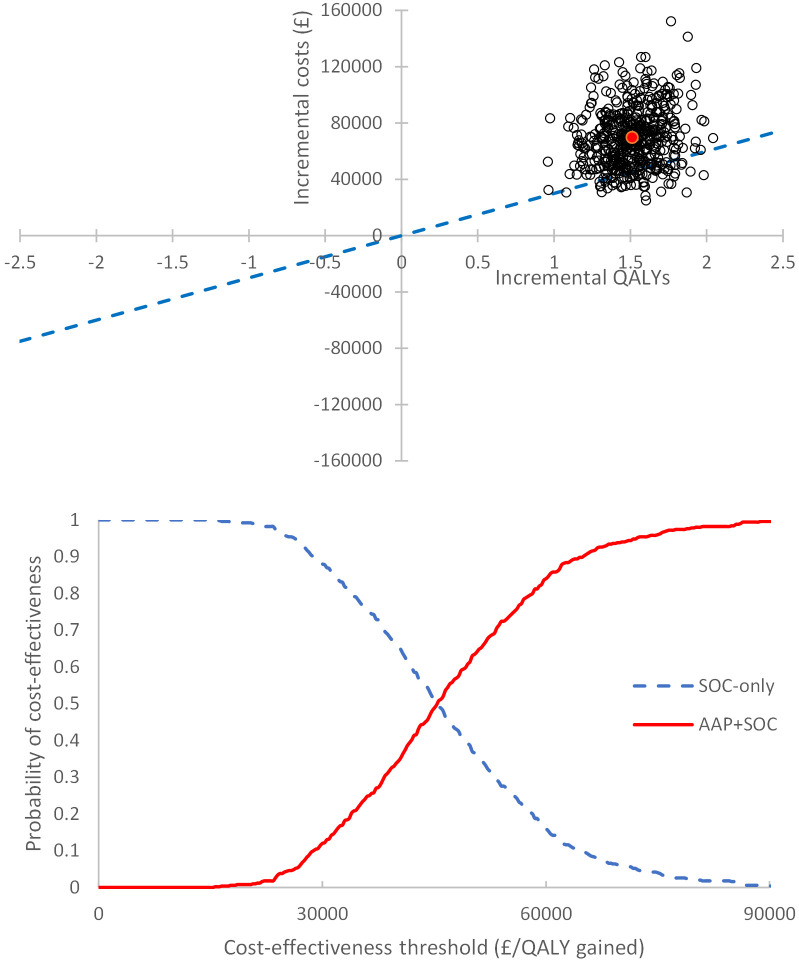
Fig 3. Cost-effectiveness plan and cost-effectiveness acceptability curve for the M1 subgroup.
Top: Cost-effectiveness plane (CEP) for M1 subgroup, using base case BNF price for abiraterone. The red point indicates the mean incremental cost plotted against the mean incremental QALYs in this set of probabilistic results and the blue dotted line indicates the £30,000/QALY gained cost-effectiveness threshold. Bottom: Cost-effectiveness acceptability curve (CEAC) for M1 subgroup, using base-case BNF price for abiraterone.

