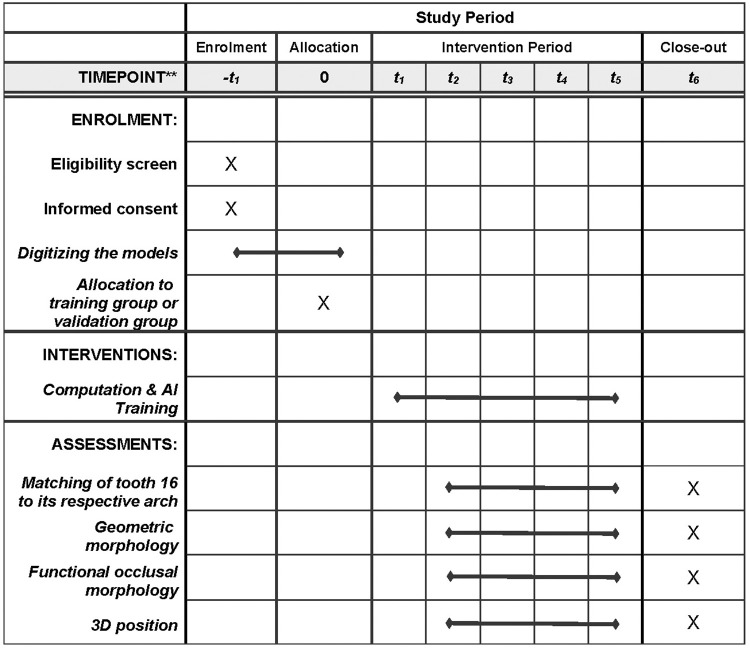
Fig 1. SPIRIT diagram showing the schedule of enrollment, allocation, interventions, and assessments of this study.
–t1 = baseline assessment (before randomization), 0 (t0) = randomization, t1 = after randomization, t2 = 25% of collected models learnt by AI, t3 = 50% of collected models learnt by AI, t4 = 75% of collected models learnt by AI, t5 = 100% of collected models learnt by AI, t6 = the whole study is completed.

