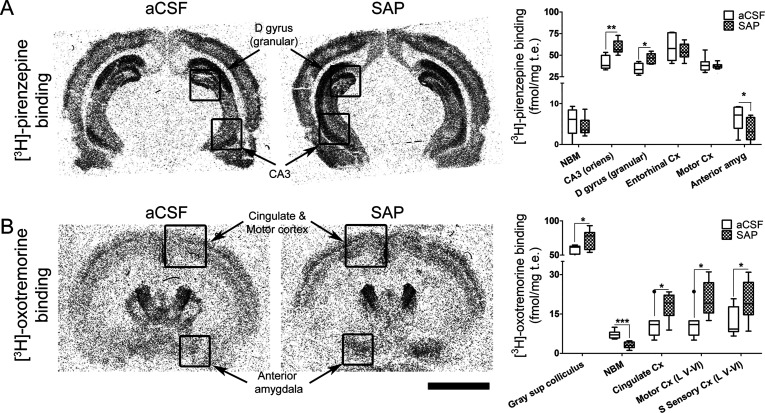
Figure 6.
[3H]-Pirenzepine binding (A) and [3H]-oxotremorine binding (B) in rat brain coronal sections obtained from aCSF (n = 7) and SAP-treated rats (n = 9) that show the specific distribution of M1 mAChR and M2 mAChR, respectively. Note the increase of both the M1 mAChR density in the hippocampus (A) and the M2 mAChR density in the deepest layers of cortex (B) and in the anterior amygdala of SAP-treated rats. Note also the loss of both M1 mAChR in the anterior amygdala (A) and M2 mAChR in the NBM (B) following the lesion. The histograms show the mean ± SEM of each group in the different areas analyzed. Scale bar: 5 mm.

