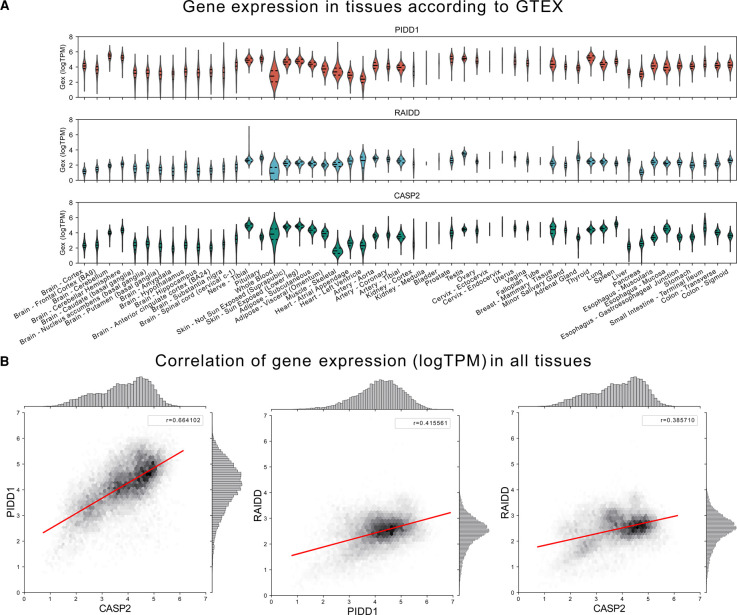
Figure 1. Expression analysis of PIDDosome components, PIDD1, RAIDD, CASP2.
(A) Tissue-specific expression of H. sapiens PIDD1, RAIDD and CASP2 obtained from the Genotype-Tissue Expression (GTEx v8) project (https://www.gtexportal.org/). mRNA expression profiles are shown as log-transformed transcript per million (log(TPM)). (B) Correlation of PIDD1, RAIDD, and CASP2 gene expression (logTPM) in human tissues based on data from GTEx v8. Pearson's correlation coefficient shown as r-value.

