
Figure 2 : APOE4 mice have an increased cortical pAkt compared to APOE3 mice following insulin injection.
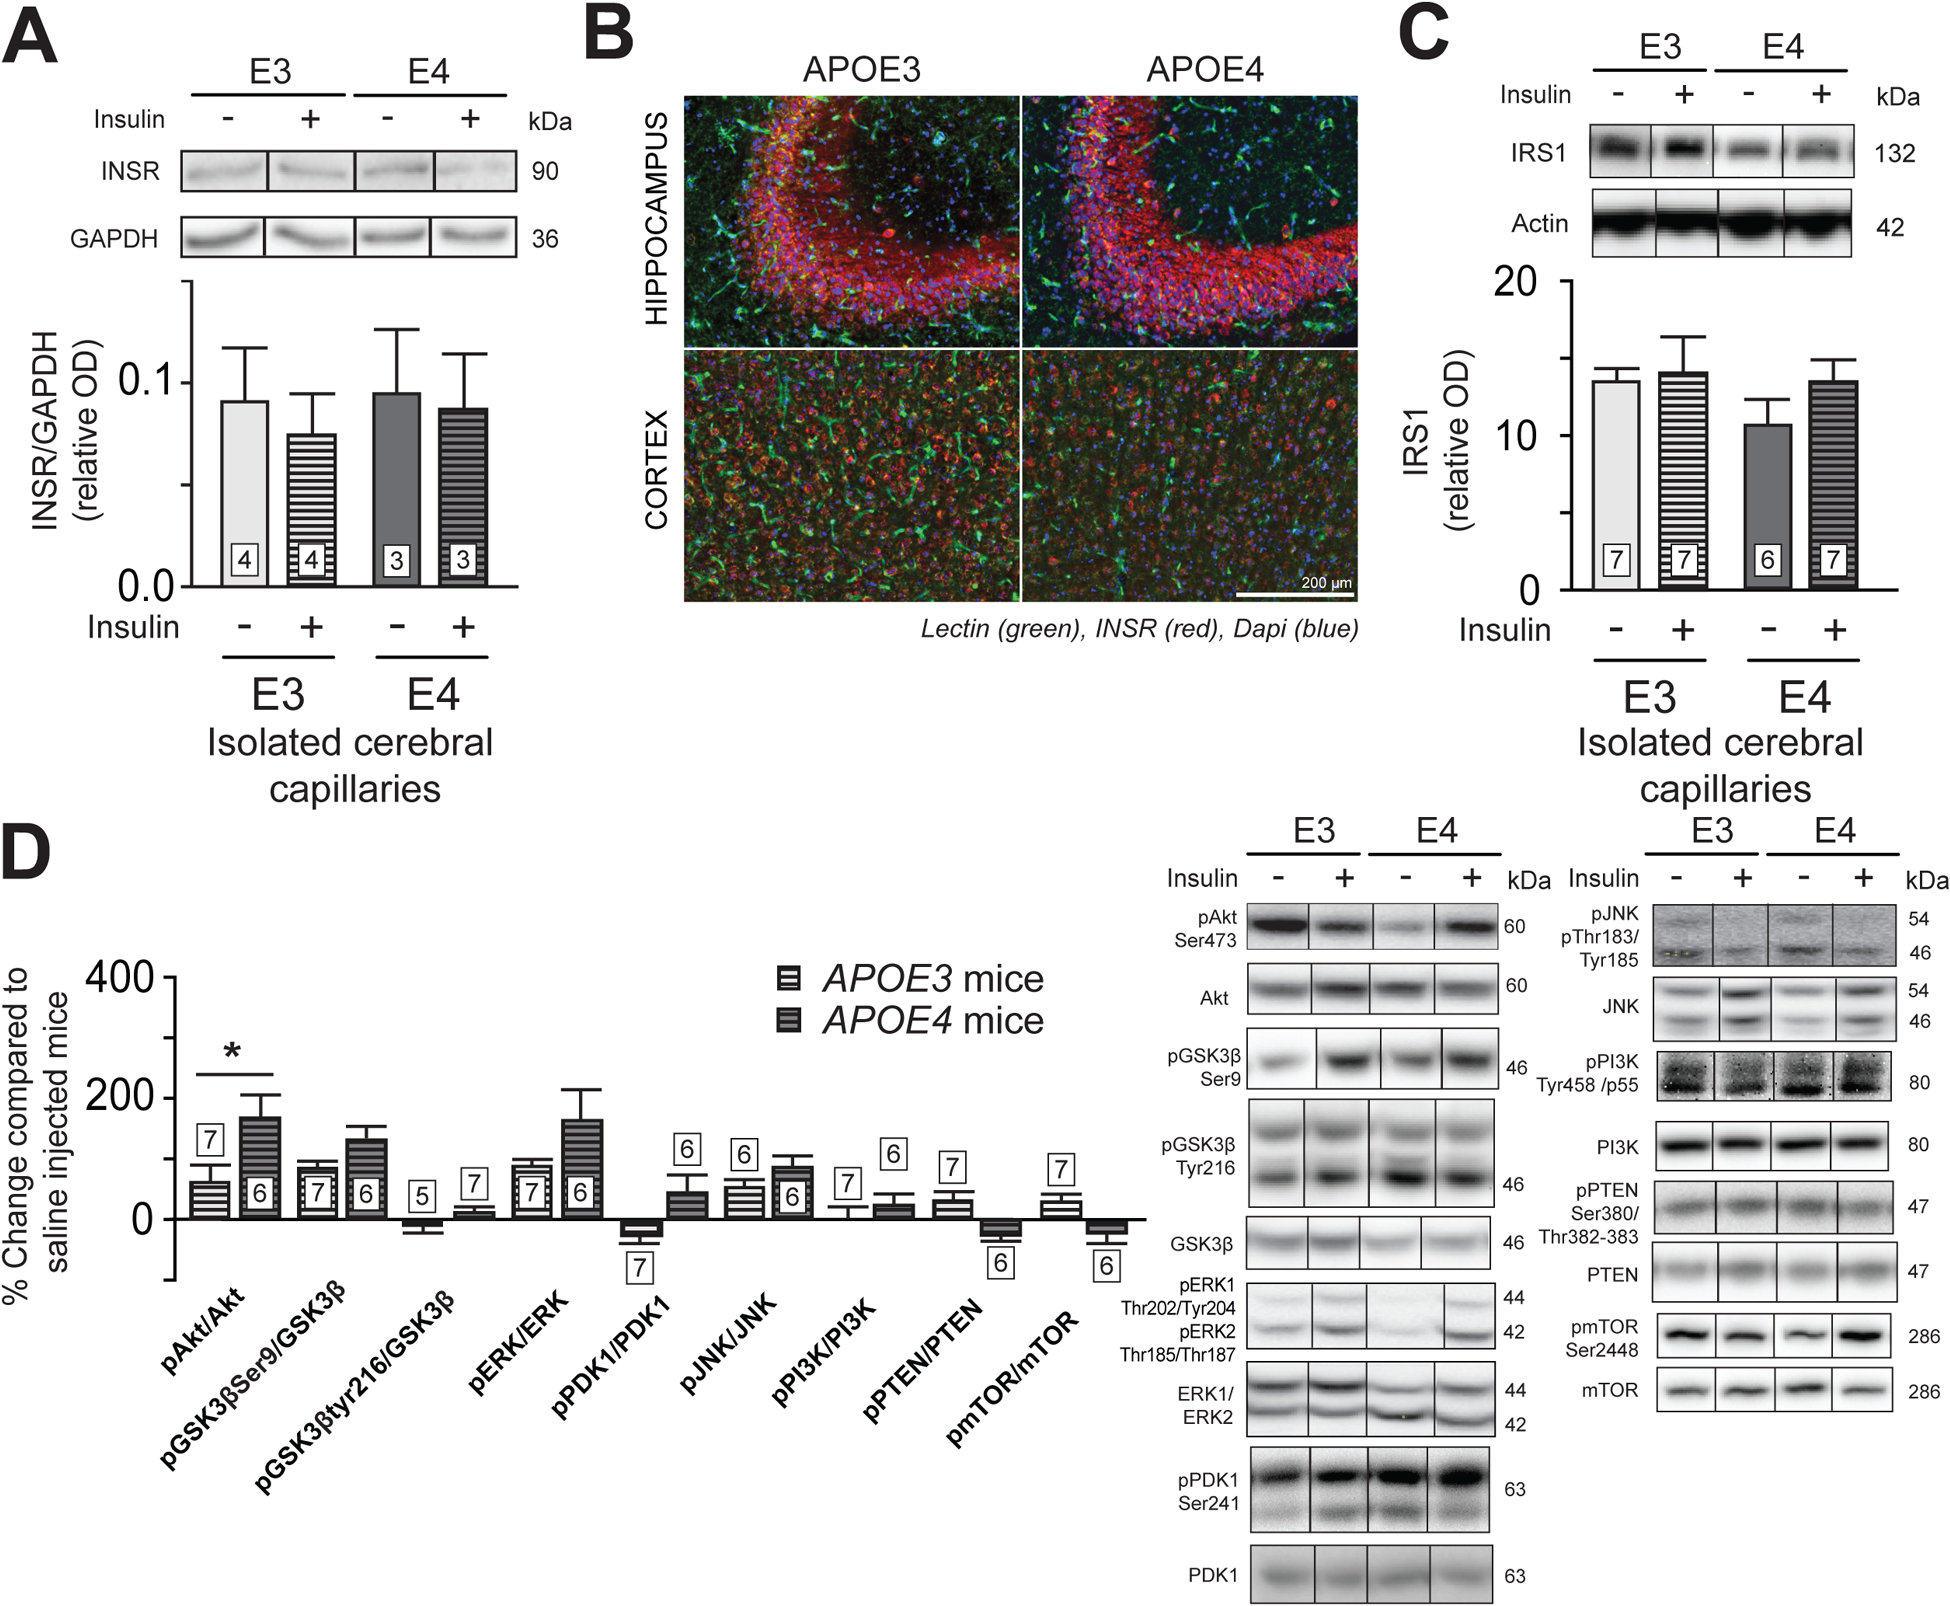
Western blot analysis in brain capillaries (A) and immunofluorescence in hippocampus and cortex (B) of INSR, and IRS1 content in brain capillaries (C). Change in concentrations of insulin signaling-related protein (D) in TBS-soluble fractions of the parietotemporal cortex of insulin injected mice compared to saline injected mice. Data are presented compared to the average of saline-injected mice. For immunofluorescence, blue = DAPI, green = blood vessels (lectin) and red = INSR. Data are presented as mean ± SEM. Data were compared with an unpaired Student t-test. *p < 0.05. INSR = insulin receptor, IRS1 = insulin receptor substrate 1, Akt = protein kinase B, PKB. GSK3β = glycogen synthase kinase-3β. ERK = extracellular signal-regulated kinases. PDK1 = Pyruvate Dehydrogenase Kinase 1. JNK = c-Jun N-terminal kinases. PI3K = Phosphoinositide 3-kinase. PTEN = Phosphatase and tensin homolog. mTOR = mammalian target of rapamycin.