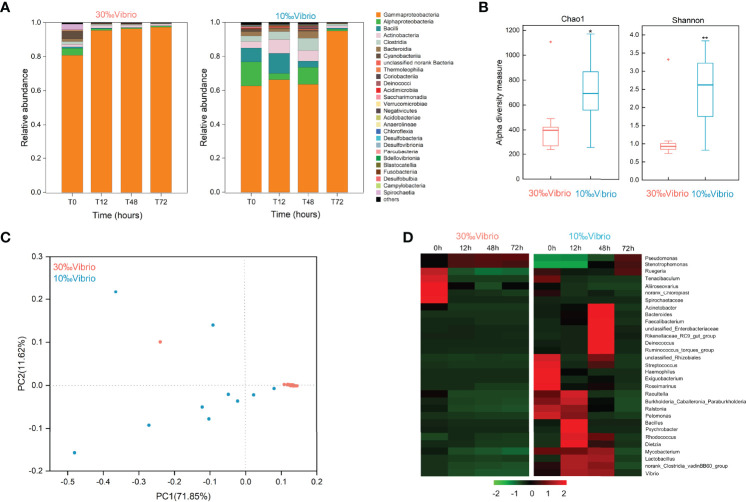
Figure 3.
Microflora changes in V. alginolyticus infected oysters exposed to salinity of 10‰ and 30‰. (A) Relative proportion of bacteria (class level) for “10‰Vibrio” and “30‰Vibrio” oysters. T0, T12, T48 and T72 indicated different sampling time-points (in hours) during the experiment. (B) Temporal dynamics of alpha diversity in V. alginolyticus infected oysters at different salinity (10‰ and 30‰). Chao1 and Shannon’s H index for “30‰Vibrio” and “10‰Vibrio” oysters. Asterisk indicated P < 0.05. (C) Principal coordinate analysis (PCoA) plot of the Bray-Curtis dissimilarity matrix of the microflora comparing “10‰Vibrio” and “30‰Vibrio” oysters. The axes of the PCoA represent the two synthetic variables that explained the most variation of the dataset. (D) The abundance of each bacteria at the genus level in “10‰Vibrio” and “30‰Vibrio” oysters. Only genera with a relative proportion >0.5% in at least one sample are shown. The abundance of each type of bacteria in “10‰Vibrio” and “30‰Vibrio” oysters at the genus level during the V. alginolyticus infection. Green colour (smaller Log10 index) indicated lower abundance. Red colour (larger Log10 index) represented higher abundance.

