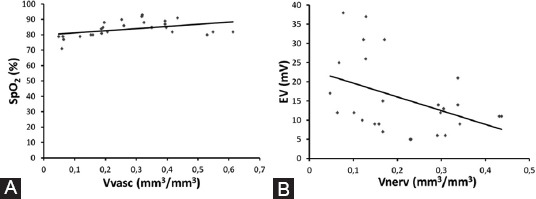
FIGURE 4.

(A) Linear correlation between the vascular volume density of the pulp tissue (Vvasc) and levels of hemoglobin oxygen saturation (SpO2) (R=0.426, p=0.030, Pearson correlation); (B) linear correlation between the volume density of nerve fibers (Vnerv) and the lowest electrical voltage (EV) felt by the patient (R=−0.420, p=0.033, Pearson correlation).
