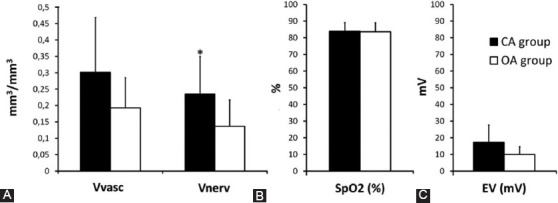
FIGURE 5.

The differences between the CA and OA groups in (A) vascular (Vvasc) and nerve fibers (Vnerv) volume density of the pulp tissue; (B) oxygen saturation (SpO2) and (C) the lowest electrical voltage (EV) felt by the patient. (*Significantly different; ANOVA, Welch test [p<0.05]).
