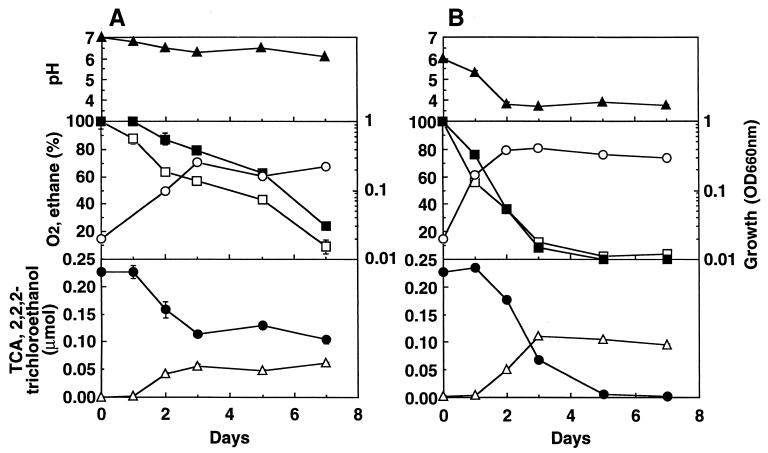
FIG. 3.
Temporal pattern of TCA degradation by strains TA5 and TA27. (A) Strain TA5; (B) strain TA27. Initial ethane concentrations: strain TA5, 10%; strain TA27, 5%. Initial pH: strain TA5, 6.8; strain TA27, 5.7. Symbols: ●, residual TCA amount; ▵, 2,2,2-trichloroethanol production; ■, residual ethane concentration; □, residual O2 concentration; ○, bacterial growth (optical density at 660 nm [OD660nm]); ▴, pH. Error bars indicate the ranges for duplicate samples.

