
Figure 2:
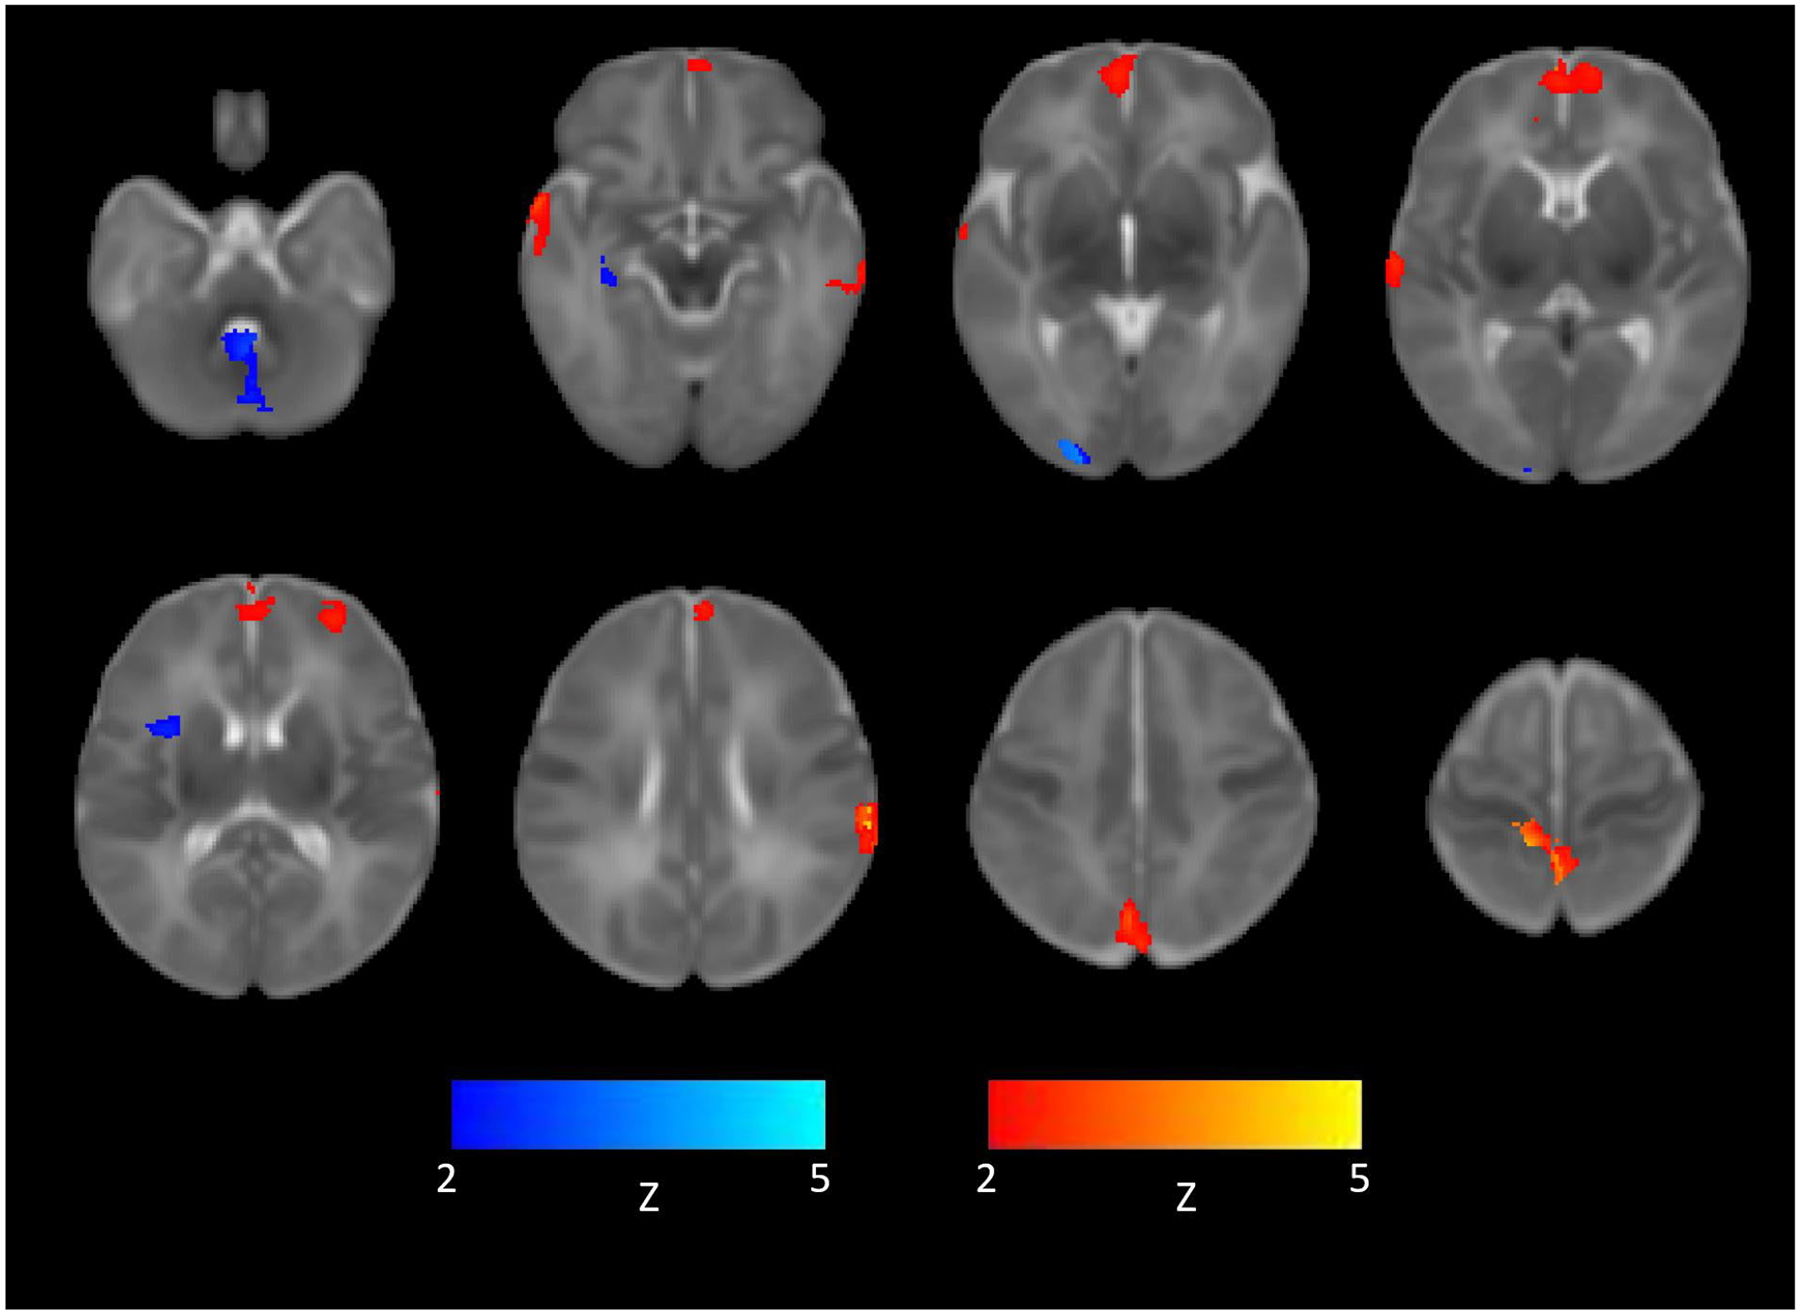
Representative images of how right and left amygdala seed region connectivity differed between the opioid exposed and opioid non-exposed groups. Warm colors indicate greater signal in opioid exposed compared to opioid non-exposed infants. Cooler colors indicate greater signal in opioid non-exposed compared to opioid exposed infants. Displayed in radiologic convention at FDR corrected cluster p ≤ 0.05.