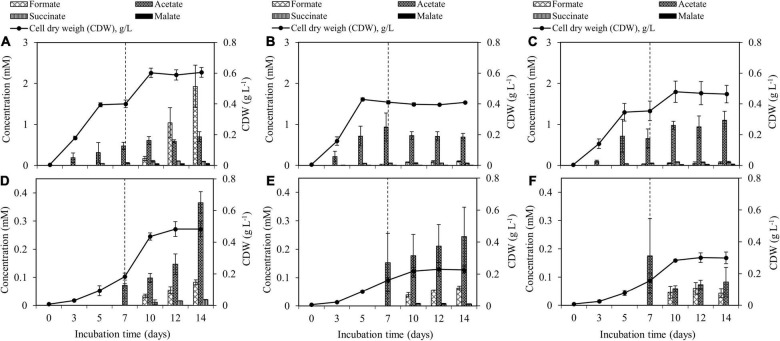
FIGURE 3.
Accumulation of organic acid production and biomass production during the 14-day incubation of M. tundripaludum SV96 (A–C) and M. rosea SV97 (D–F) under three different gas supplementation schemes applied on day 7: (test I) both CH4 and air added (A,D), (test II) only CH4 added (B,E), and (test III) only air added (C,F). Error bars indicate the standard deviation of triplicate samples.

