
Figure 3.
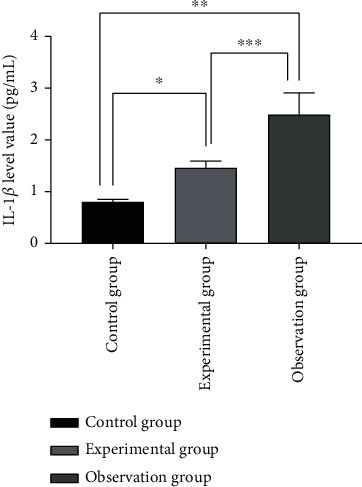
Comparison of IL-1β levels of inflammatory factors in the three groups (). Note: the abscissa represents the control group, experimental group, and observation group; the ordinate represents the level of IL-1β (pg/ml); the level of IL-1β of the control group was 0.80 ± 0.05 pg/ml; the level of IL-1β of the experimental group was 1.46 ± 0.13 pg/ml; the level of IL-1β in the observation group was 2.49 ± 0.42 pg/ml; ∗ indicates that there is a significant difference in IL-1β levels between the control group and the experimental group (t = 25.954, P < 0.001); ∗∗ indicates that there is a significant difference in IL-1β levels between the control group and the observation group (t = 21.885, P < 0.001); ∗∗∗ indicates that there is a significant difference in IL-1β levels between the experimental group and the observation group (t = 12.832, P < 0.001);