Figure 3.

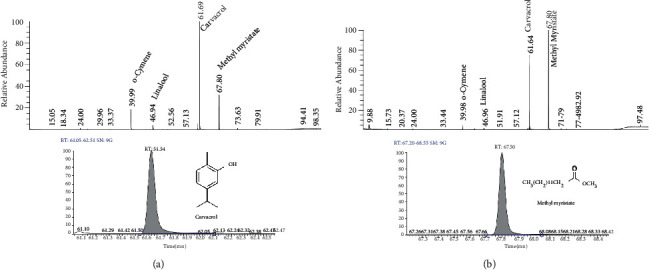
Gas chromatographic-mass spectrum (GC-MS) analysis of OENE: The GC and GC-MS spectrum showed major constituents and their relative abundance in both oregano EO (a) and OENE (b).

Gas chromatographic-mass spectrum (GC-MS) analysis of OENE: The GC and GC-MS spectrum showed major constituents and their relative abundance in both oregano EO (a) and OENE (b).