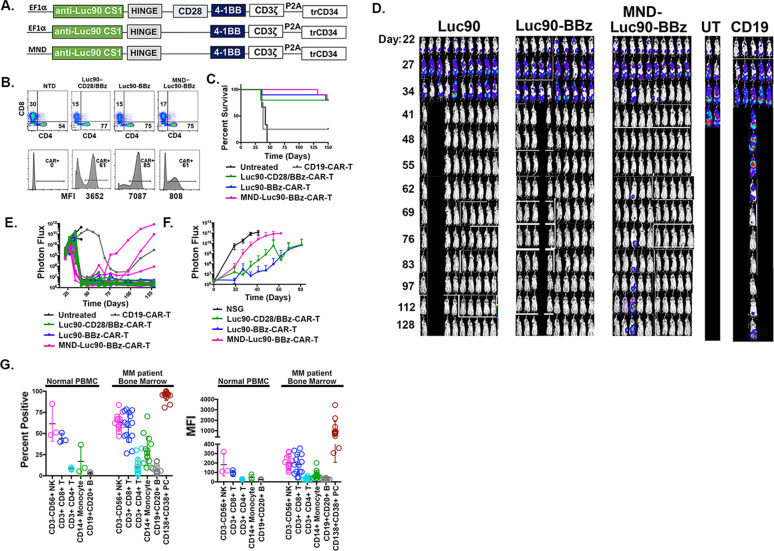
Fig. 6. MND promoter drives lower CAR copy number but demonstrates efficacy in vivo.
A CAR constructs. B Top row is flow cytometry of CD4 and CD8 cells as indicated. Bottom row are presorted CAR + cell percentages (assessed by flow using anti-CD34 antibody that binds to truncated CD34 that follows the P2A cleavage site). Below are the mean fluorescence intensities (MFI) of CAR + cells. C Kaplan–Meier survival analysis. D BLI and (E) Normalized images of the BLI. F Luc90-CAR-T (n = 7), Luc90-BBz (n = 7), MND-Luc90-CS1-CAR-T (n = 5) and NSG controls (n = 5) were re-challenged with 0.5 × 10⁶ MM.1S-CG. Longitudinal BLI shown. G Binding of Luc90 to normal hematopoietic and myeloma cells. Left: Percent of cells from normal PBMC or unsorted bone marrow myeloma samples that bound to Luc90 antibody using flow cytometry. Right: Mean fluorescence analysis demonstrating CS1 levels in cell subsets shown.

