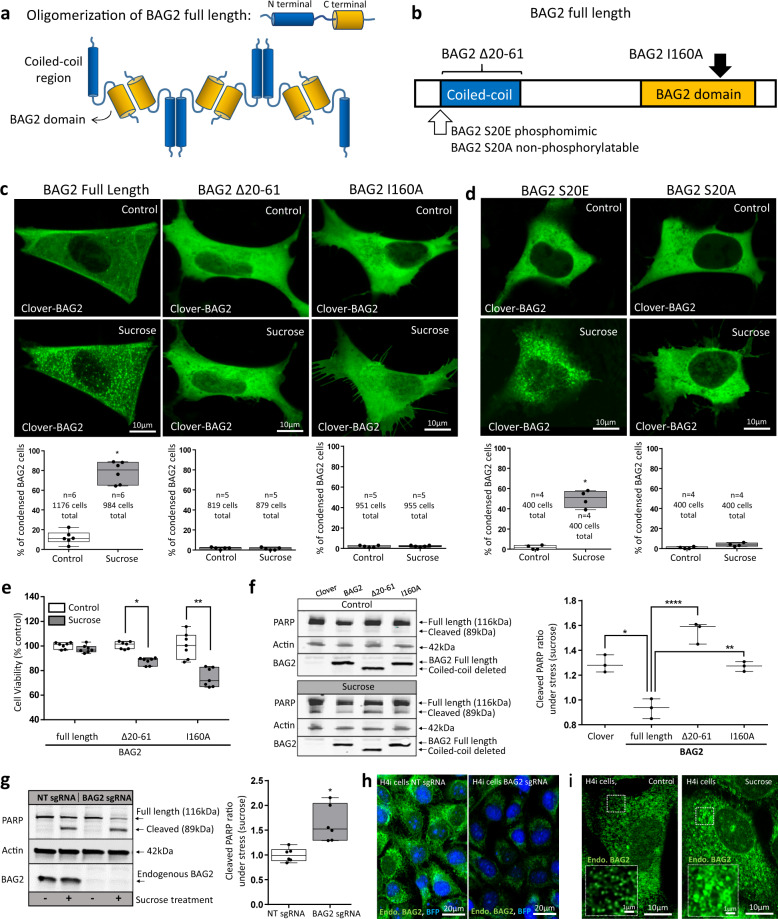
Fig. 3. Mutational analysis of BAG2 condensate function.
a Model of a multi-oligomerization structure of BAG2-full length protein representing the N and C termini interactions. b Mutation sites used to study BAG2 condensation in c–f. c Representative images (top) and plot (bottom) showing SH-SY5Y cells transfected with clover-BAG2 full length, clover-BAG2-Δ20-61 and clover-BAG2-I160A before and after stress (Sucrose 125 mM, 15 min). Plots: the percentage of clover-BAG2 cells that contained condensates before and after stress (*p = 1.9 × 10⁻⁷, two-sided Student’s t test). d Same experiment performed in c using clover-BAG2-S20E (phosphomimetic) and clover-BAG2-S20A (non-phosphorylatable) before and after stress (Sucrose 125 mM, 15 min, *p = 3.5 × 10⁻⁵, two-sided Student’s t test). e Cell viability as measured by the CellTiter-Glo(R) Luminescent Cell Viability Assay kit in control and after stress (500 mM, 2 h) in SH-SY5Y cells transfected with clover-BAG2 full length, clover-BAG2-Δ20-61 and clover-BAG2-I160A (7 independent replicates, *p = 2.1 × 10⁻³, **p = 7.5 × 10⁻⁹, two-way ANOVA followed by the Tukey`s test). f Western blotting against PARP, Actin and BAG2 in SH-SY5Y lysates of cells transfected with empty vector (Clover), BAG2 full length, BAG2-Δ20-61 and BAG2-I160A and subjected to stress (Sucrose 500 mM, 2 h). Blots and densitometry quantification of 3 independent replicates. Beta-actin was used as a loading control (*p = 1.3 × 10⁻³ for BAG2 full length; ****p = 2.6 × 10⁻⁵ for BAG2-Δ20-61; **p = 1.8 × 10⁻³ for BAG2-I160A; one-way ANOVA followed by the Tukey`s test). Line: median. Plots: smallest to the largest values. Points represent replicates. g Western blotting against PARP, Actin and BAG2 in H4i cells transduced with BAG2 sgRNA and NT sgRNA before and after stress (sucrose, 500 mM, 2 h). Six independent replicates *p = 0.0027; two-sided Student’s t test. h BAG2 immunocytochemistry images of H4i cells transduced with NT sgRNA and BAG2 sgRNA. BFP: CRISPRi machinery fluorescence marker (H4i). i BAG2 immunocytochemistry images of the regular H4 cells before and after stress (Sucrose, 125 mM, 30 min). c–e, g Box and whiskers: the boxplots are centered around the median and extend from the 25th to 75th percentiles. The whiskers go down to the smallest value and up to the largest. Dots represent replicates.

