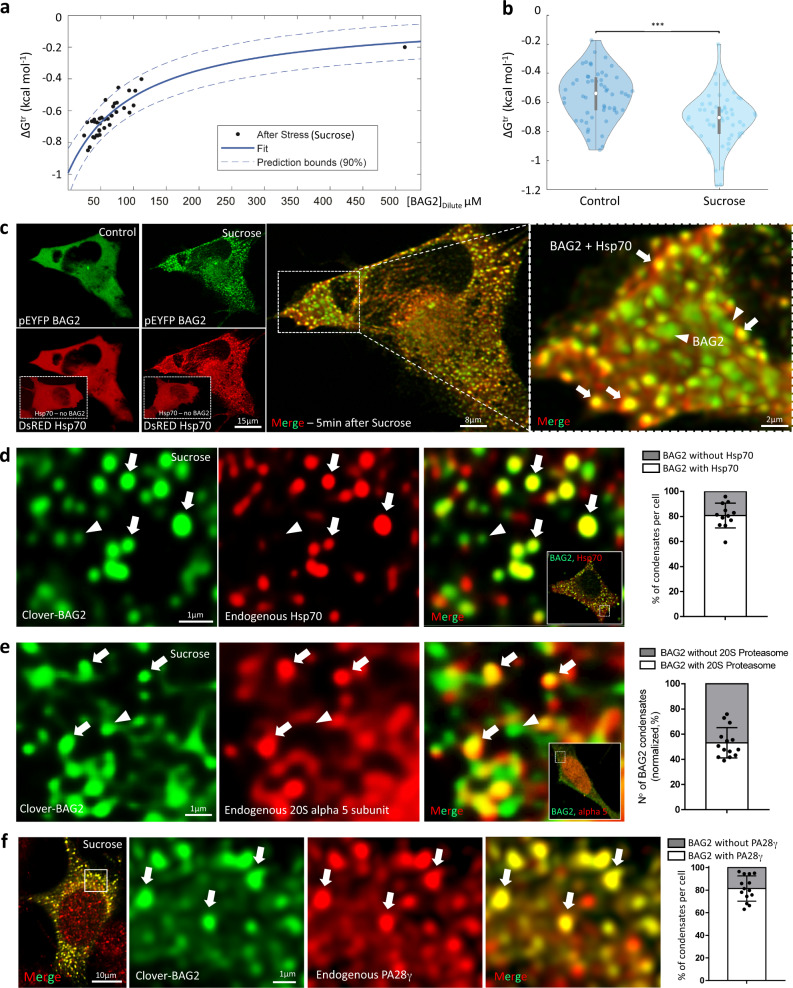
Fig. 4. BAG2 condensates are multicomponent entities.
a DeltaG Plot, dependence of the transfer free energy on the concentration of BAG2 in the dilute phase. The solid line represents the best fit of the data, while the dotted lines represent the 90% mean confidence interval (see methods). The nonlinear, increasing ΔGtr as a function of BAG2 concentration indicates that heterotypic interactions control BAG2 phase separation. b SH-SY5Y cells stably expressing clover-BAG2 were analyzed by fluorescence correlation spectroscopy (FCS) before and after stress. Stress increased the heterotypic interactions inside the BAG2 condensates. Violin plots of the transfer free energy of condensates formation before and after the addition of sucrose. The two white circles represent the medians, while the gray bars are the interquartile range. Each dot represents the average transfer free energy of a single cell (5 independent replicates, 54 cells analyzed, two-sided Pairwise Student’s t test, ***p = 4.6 × 10⁻⁶). c SH-SH5Y cells transiently expressing pEYFP-BAG2 and DsRED-Hsp70 subjected to stress (Sucrose 125 mM, 5 min). Arrows in the zoomed right panel indicate co-localization of Hsp70 and BAG2 condensates. Arrowheads indicate BAG2 condensates without Hsp70. Inserts in the Hsp70 panels (red) show representative images of SH-SY5Y cells transfected only with Hsp70 (no BAG2) and subjected to stress highlighting the absence of Hsp70 condensates under this condition. Images of endogenous Hsp70 (d), endogenous 20S alpha 5 subunit of the proteosome (e) or endogenous PA28 gamma (f) immunostaining in SH-SY5Y cells stably expressing clover-BAG2 subjected to stress (Sucrose 125 mM, 30 min). Arrows indicate colocalization between BAG2 condensates and Hsp70 (d), proteosome 20S alpha 5 subunit (e) or PA28 gamma (f) while arrowheads highlight the presence of clover-BAG2 condensates with absence of Hsp70 or proteosome 20S alpha 5 subunit immunolabeling. The quantification of the co-localization is graphically depicted [4020 BAG2 condensates analyzed in 12 cells (d); 3996 BAG2 condensates in 14 cells (e) and 1988 BAG2 condensates in 14 cells)]. All from 3 independent replicates, d–f. Dots represent the percentage of BAG2 condensates colocalized with Hsp70, 20S alpha 5 subunit and PA28 gamma from each individual cell. Line is centered around the mean ± SD.

