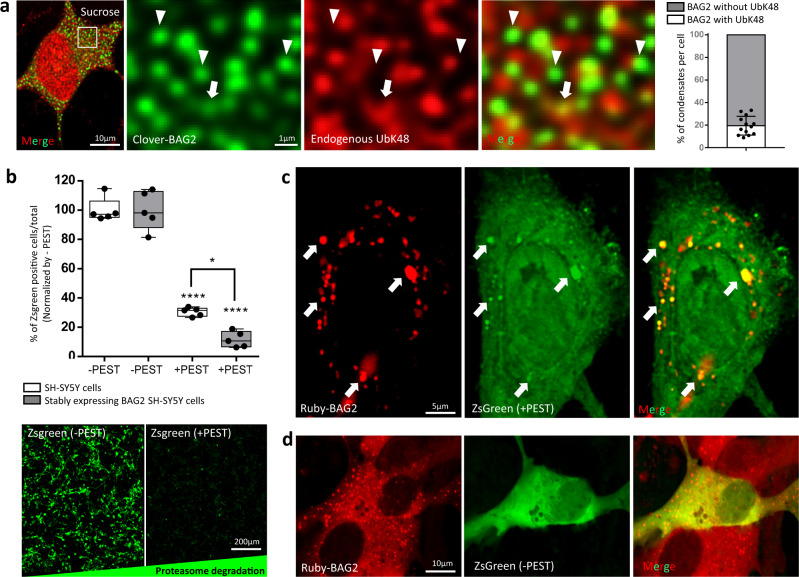
Fig. 5. BAG2 condensates function as degradation granules.
a SH-SY5Y cells stably expressing clover-BAG2 immunostained for endogenous ubiquitin-K48. Arrows indicate colocalization between clover-BAG2 and ubiquitin-K48. In most BAG2 condensates ubiquitin-K48 immunolabeling was absent (arrowhead). The quantification of the colocalization is shown (2752 BAG2 condensates analyzed in 13 cells from 3 independent replicates). Dots represent the percentage of BAG2 condensates colocalized with ubiquitin-K48 from each individual cell. Line is centered around the mean ± SD. b Percentage of ZsGreen positive cell per total in SH-SY5Y cells and ruby-BAG2 stable cells transiently expressing ZsGreen alone (−PEST) or ZsGreen fused to PEST (+PEST). As expected, the +PEST signal was markedly decreased in both cell types as compared to its respective −PEST (****p = 3.5 × 10⁻⁹ for control and ****p = 8.9 × 10⁻¹¹ for stably BAG2 cells); however, the presence of +PEST had a higher clearance of ZsGreen in mRuby-BAG2 stable cells as compared to +PEST control SH-SY5Y cells (*p = 1.2 × 10⁻²). Two-way ANOVA followed by the Tukey’s test, 5 independent replicates. Representative images of the ZsGreen labeling are shown at the bottom. Box and whiskers: the boxplots are centered around the median and extend from the 25th to 75th percentiles. The whiskers go down to the smallest value and up to the largest. Dots represent replicates. c Representative images using higher laser intensity of ruby-BAG2 stable cells expressing the ZsGreen (+PEST) showed co-localization between +PEST signal and BAG2 condensates (arrows). 3 independent replicates. d As a control, ruby-BAG2 cells expressing the ZsGreen alone (−PEST) showed no co-localization between signals. 3 independent replicates.

