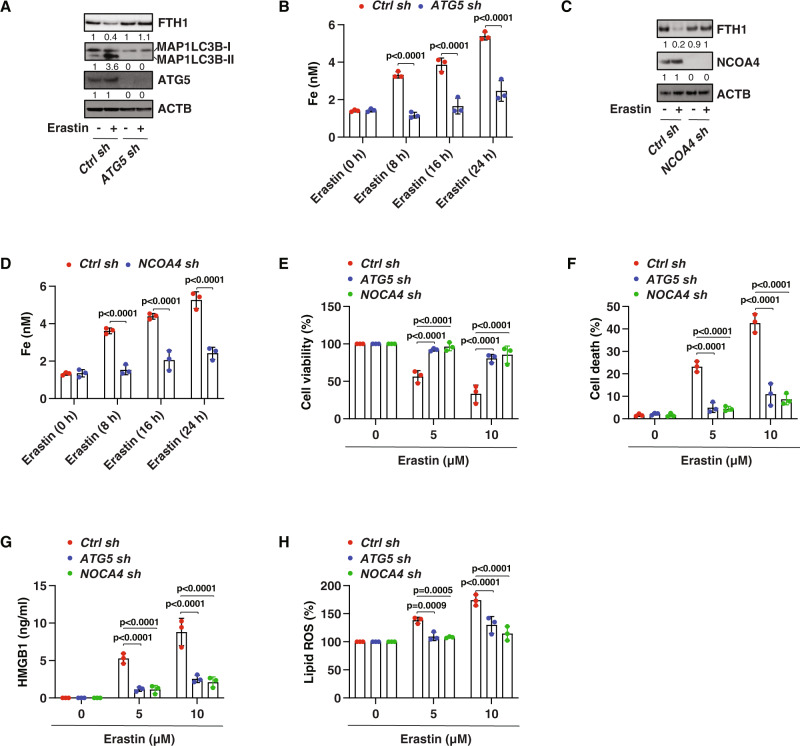
Fig. 3. Ferritinophagy mediates ferroptotic tumor suppression.
A Western blot analysis of protein expression in control and ATG5-knockdown Y79-CR cells following treatment with erastin (10 µM) for 24 h. B Analysis of intracellular free iron in control and ATG5-knockdown Y79-CR cells following treatment with erastin (10 µM) for 8–24 h (two-way ANOVA with Tukey’s multiple comparisons test; data are presented as mean ± SD; n = 3 biologically independent samples). C Western blot analysis of protein expression in control and NCOA4-knockdown Y79-CR cells following treatment with erastin (10 µM) for 24 h. D Analysis of intracellular free iron in control and NCOA4-knockdown Y79-CR cells following treatment with erastin (10 µM) for 8–24 h (two-way ANOVA with Tukey’s multiple comparisons test; data are presented as mean ± SD; n = 3 biologically independent samples). E–H Indicated Y79-CR cells were treated with erastin (5–10 µM) for 24 h, and then cell viability (E), cell death (F), HMGB1 release (G), and lipid ROS (H) were assayed (two-way ANOVA with Tukey’s multiple comparisons test; data are presented as mean ± SD; n = 3 biologically independent samples).

