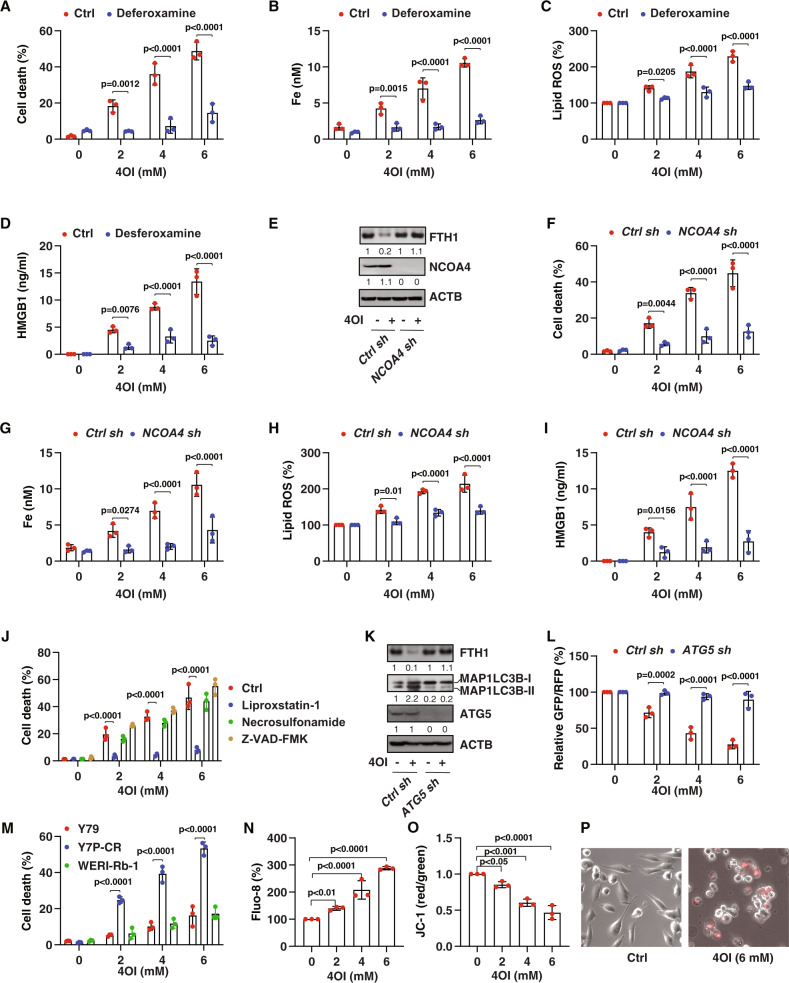
Fig. 4. Itaconate-induced ferritinophagy eliminates drug-resistant cells.
Y79-CR cells were treated with 4OI (2–6 mM) in the absence or presence of deferoxamine (50 µM) for 24 h, and then cell death (A), intracellular free iron (B), lipid ROS (C), and HMGB1 release (D) were assayed (two-way ANOVA with Tukey’s multiple comparisons test; data are presented as mean ± SD; n = 3 biologically independent samples). E Western blot analysis of protein expression in control and NCOA4-knockdown Y79-CR cells following treatment with 4OI (4 mM) for 24 h. The indicated Y79-CR cells were treated with 4OI (2–6 mM) for 24 h, and then cell death (F), intracellular free iron (G), lipid ROS (H), and HMGB1 release (I) were assayed (two-way ANOVA with Tukey’s multiple comparisons test; data are presented as mean ± SD; n = 3 biologically independent samples). J Y79-CR cells were treated with 4OI (2–6 mM) in the absence or presence of liproxsatin-1 (1 µM), necrosulfonamide (1 µM), or Z-VAD-FMK (10 µM) for 24 h, and then cell death was assayed (two-way ANOVA with Tukey’s multiple comparisons test; data are presented as mean ± SD; n = 3 biologically independent samples). M The indicated human RB cells were treated with 4OI (2–6 mM) for 24 h, and then cell death was assayed (two-way ANOVA with Tukey’s multiple comparisons test; data are presented as mean ± SD; n = 3 biologically independent samples). N–P Y79-CR cells were treated with indicated 4OI for 24 h, and then cytosolic calcium (Fluo-8 staining), mitochondrial membrane potential (JC-1 staining), and cell morphology (propidium iodide staining) were assayed (one-way ANOVA with Tukey’s multiple comparisons test; data are presented as mean ± SD; n = 3 biologically independent samples).

