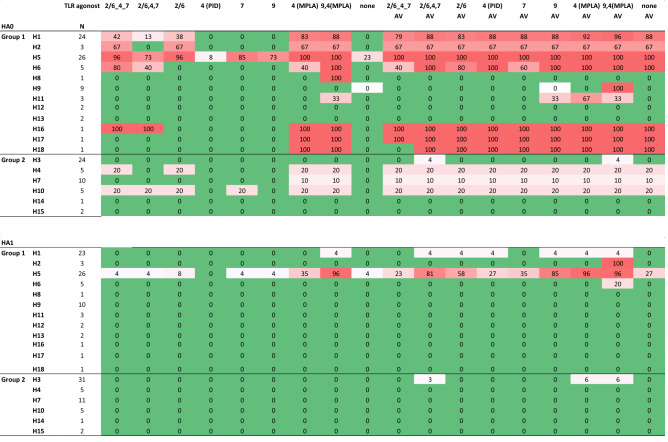
Table 2.
Summary of breadth of response elicited by H5 administered in different adjuvants.
Values are percentages of seropositive variants within each HA subtype printed on the array (both full-length HA0 and HA1 fragment) using data shown in Figs. 1 and 2. HA subtypes are organized into phylogenetic group 1 or 2. The cutoff for seropositivity was defined for each formulation with Log2 transformed data using the mean + 2SD of an irrelevant antigen, neuraminidase.
N number of variants in each subtype on the array, AV AddaVax, other abbreviations as per Fig. 1.

