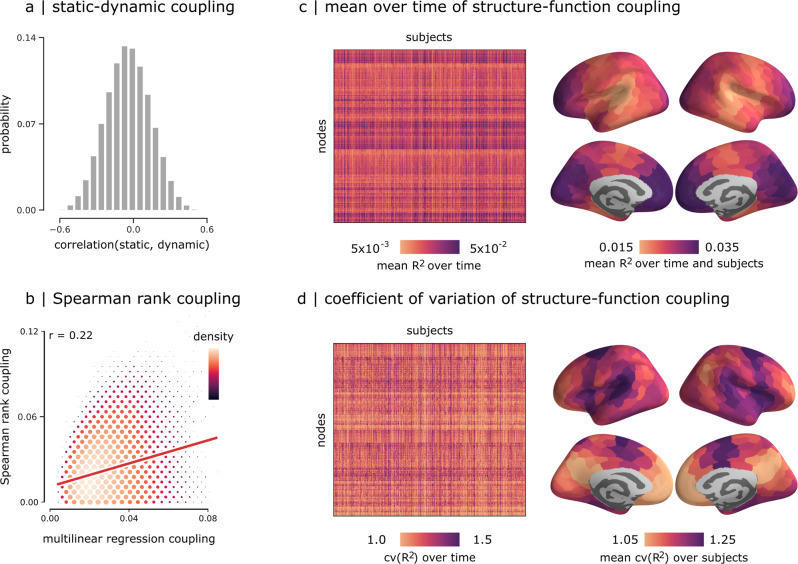
Fig. 2. Dynamic structure-function coupling.
a Correlations between regional patterns of static and dynamic structure-function coupling. b Correlations between dynamic structure-function coupling estimated using a multilinear model23 versus coupling estimated using an alternative Spearman rank correlation method21. Scatter color and size represent the density. c Mean time-resolved structure-function coupling over time (left) and its mean over subjects (right). d Coefficient of variation of structure-function coupling across time (left), and its mean over subjects (right).

