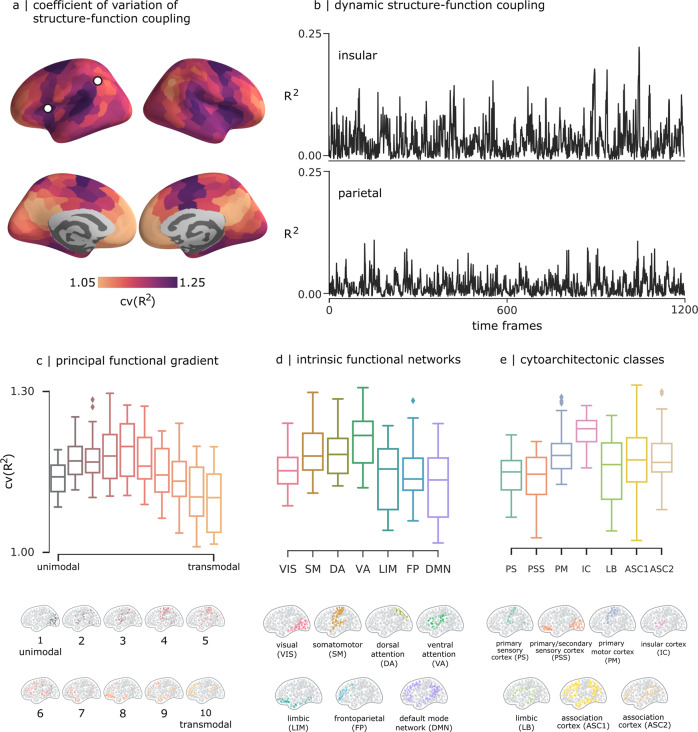
Fig. 3. Relationship with cortical hierarchies.
a Coefficient of variation of structure-function coupling, averaged over all participants. b Time-series of regional structure-function coupling shown for one region in parietal cortex (left) and one region in insular cortex (right) from one randomly selected participant. The mean coefficient of variation is displayed for three types of cortical annotations: c 10 equally-sized bins of the principal functional gradient41, d intrinsic functional networks40, and e von Economo cytoarchitectonic classes42.

