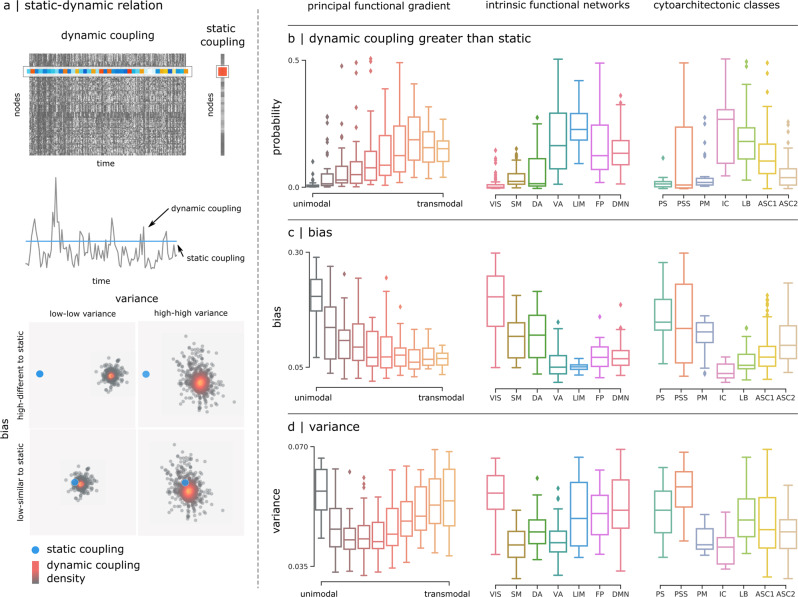
Fig. 4. Relating static and dynamic structure-function coupling.
a Top: static structure-function coupling is estimated using the functional connectivity matrix derived from the whole resting-state time-series23, and compared with dynamic coupling. The dynamic structure-function coupling of node i corresponds to the ith row of the dynamic coupling matrix, while the static coupling corresponds to the ith element of static coupling vector. Middle: dynamic values represented as a time-series (black line) that fluctuates around the single static coupling value (blue line). Bottom: dynamic coupling values are represented as a scattered distribution of points (black) around the static coupling value (blue point). The two are compared in different cortical annotations using three summary statistics: b the probability of having a larger dynamic coupling value compared to the static coupling, c the bias, and d the variance of the dynamic coupling to reproduce the static values.

