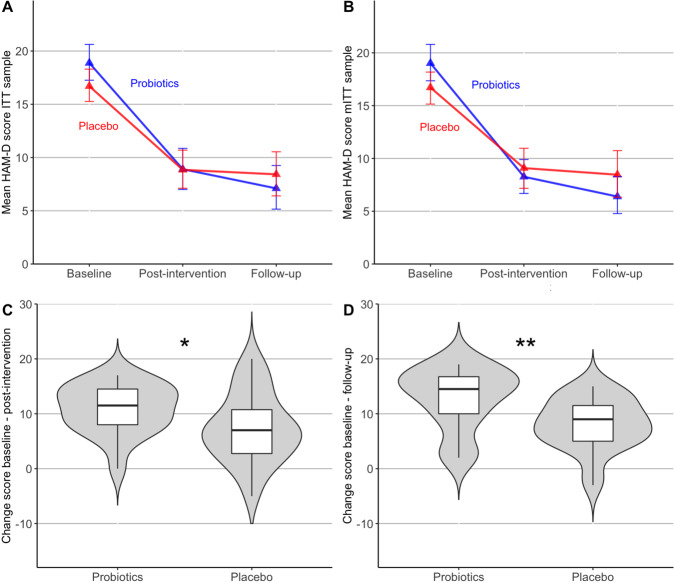
Fig. 1. Trajectories and change scores of depressive symptoms in the probiotics and placebo group.
Mean trajectory of scores on the Hamilton Scale for Depression (HAM-D) from baseline to post-intervention (week 4) and follow-up assessment (week 8) in A the intention-to-treat sample (ITT) and B the modified intention-to-treat sample (mITT). Error bars indicate 95% confidence interval (based on a bootstrap). C Change scores from baseline to post-intervention in the mITT sample and D from baseline to follow-up.

