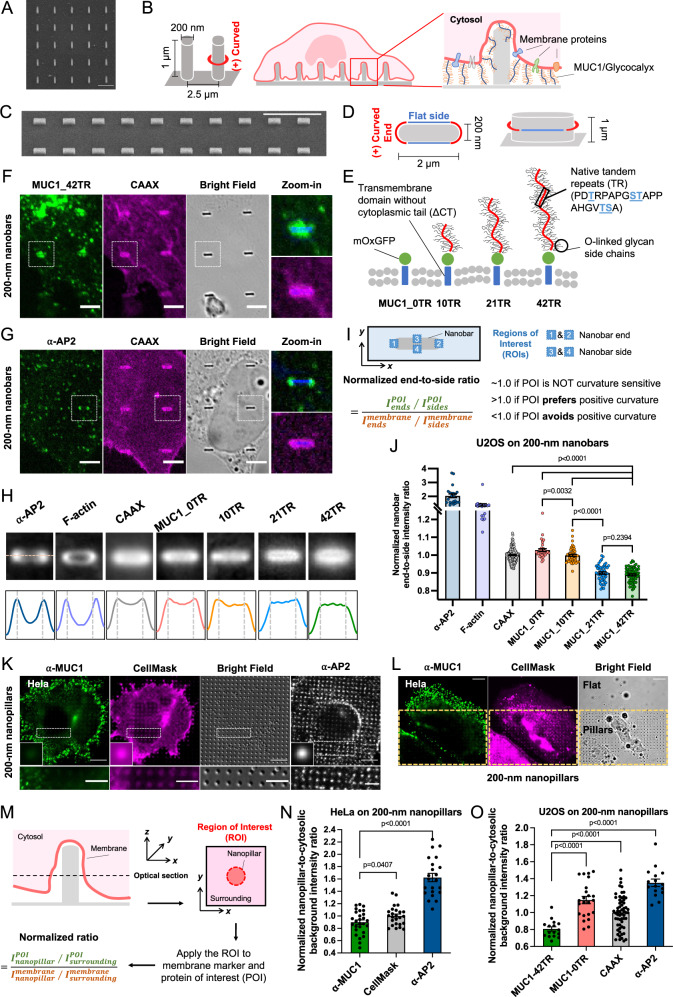
Fig. 1. MUC1 avoids positively-curved membranes induced by vertical nanobars and nanopillars.
A A scanning electron microscopy (SEM) image (tilted at 45°) of the 200-nm-diameter nanopillar arrays. B Schematic illustration of positive membrane curvature induced by nanopillars. C An SEM image (tilted at 45°) of 200-nm-wide nanobar arrays. D Schematic illustration of a nanobar that induces positive membrane curvature at two ends and flat membranes along the side walls. E Schematic illustration of MUC1-CT-mOxGFP constructs with varying numbers of tandem repeats (TRs). F, G Confocal images of (F) U2OS cells co-transfected with MUC1_42TR-GFP and mCherry-CAAX or (G) mCherry-CAAX-transfected U2OS cells stained with anti-AP2 on 200-nm nanobar arrays. Bright-field images of nanobars in the zoom-in subsets were converted into blue colors for visualization. H Averaged fluorescence images and intensity profiles show the spatial distributions of MUC1 variants of varying lengths, mCherry-CAAX, AP2, and F-actin on 200-nm nanobar arrays. I Illustrations of the quantification process for the normalized nanobar end-to-side ratio. J Quantification of nanobar end-to-side ratios of AP2, F-actin, and MUC1-GFP of different lengths, normalized to the mean ratio of CAAX. K Confocal images of Hela cells cultured on the 200-nm nanopillar arrays. Membranes were visualized via CellMask staining and MUC1 was immunostained with anti-MUC1. In a separate experiment, cells were stained with anti-AP2 that serves as a control. The insets are the averaged images of proteins at nanopillars. L A Hela cell cultured at the nanopillar-flat boundary. M Illustrations of the quantification process for the normalized nanopillar-to-surrounding ratio. N Quantification of nanopillar-to-surrounding ratios of α-MUC1, CellMask, and AP2 signals in Hela cells on the 200-nm nanopillar arrays. O Quantification of nanopillar-to-surrounding ratios for MUC1_42TR-GFP, MUC1_0TR-GFP, mCherry-CAAX, and AP2 signals in U2OS cells. See Supplementary Tables 1 and 2 for the detailed statistics. Scale bars = 10 µm for C, K, L; Scale bars = 5 µm for F, G, and zoom-in images in K; Scale bars = 2 µm for A. Welch’s t-tests (unpaired, two-tailed, not assuming equal variance) are applied for all statistical analyses in this figure. Error bars represent SEM.

