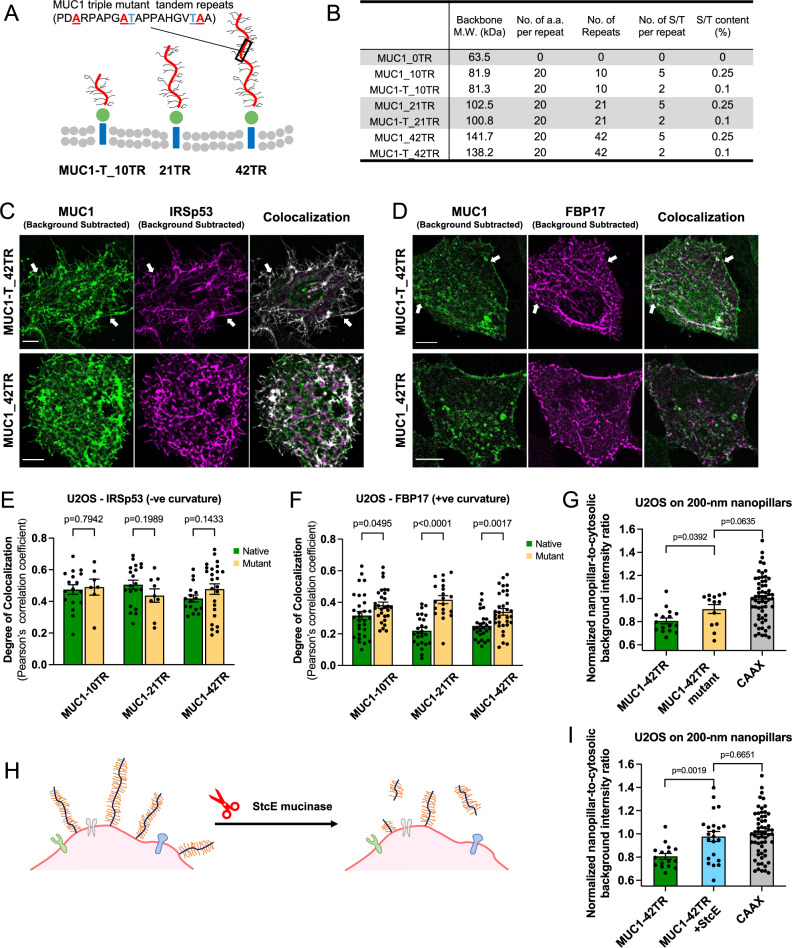
Fig. 4. Reduction of the glycosylation level or cleavage of the ectodomain reduces MUC1’s avoidance of positive curvature.
A Schematic illustration of MUC1 triple mutants of varying lengths. B Comparison between native MUC1 and triple mutants in their molecular weight and expected glycosylation levels. (MW molecular weight, a.a. amino acids, S/T serine/threonine). C Confocal images of U2OS cells co-transfected with IRSp53-mCherry and either MUC1_42TR-GFP or its triple mutant MUC1-T_42TR-GFP. Scale bars represent 10 µm. D Confocal images of U2OS cells co-transfected with mCherry-FBP17 and either MUC1_42TR-GFP or its triple mutant MUC1-T_42TR-GFP. Scale bars represent 10 µm. E Colocalization analysis of the wildtype and triple mutants of different lengths with IRSp53 (see Supplementary Table 4A for the detailed statistics). F Colocalization analysis of the wildtype and triple mutants of different lengths with FBP17 shows that triple mutants of MUC1 with 21TRs and 42TRs have increased colocalization with FBP17 (see Supplementary Table 4B for the detailed statistics). G Quantification of nanopillar-to-surrounding ratios shows that triple mutant MUC1-T_42TR-GFP has increased presence at 200-nm nanopillars (see Supplementary Table 2B for the detailed statistics). H Schematic illustration of cell surface mucin removal by StcE mucinase. I Quantification of nanopillar-to-surrounding ratios shows that StcE treatment significantly increased MUC1_42TR-GFP signals at 200-nm nanopillars (see Supplementary Table 2B for the detailed statistics). All ratios are normalized against the mCherry-CAAX signals. In C, D, cells were cultured on flat surfaces. Welch’s t-tests (unpaired, two-tailed, not assuming equal variance) are applied for all statistical analyses in this figure. Error bars represent SEM. Arrows were drawn for guidance purpose.

