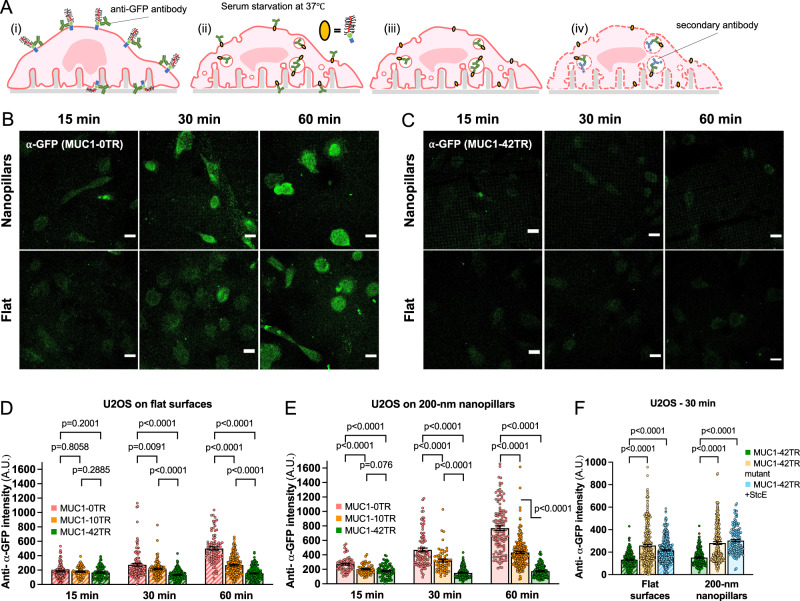
Fig. 6. MUC1’s avoidance of positively-curved membranes reduces its removal from the plasma membrane.
A Schematic illustration of the MUC1 endocytosis assay performed on the 200-nm nanopillar arrays. Cells expressing MUC1-GFP were live-cell stained with anti-GFP antibodies at 4 °C, then warmed up to 37 °C to allow endocytosis for a certain duration under serum-deprived conditions. Then, surface-bound anti-GFP were acid stripped before cells were fixed and probed for internalized MUC1-GFPs. B, C Confocal images show the immunofluorescent signals of internalized (B) MUC1_0TR-GFP and (C) MUC1_42TR-GFP in U2OS cells at different time points on either 200-nm nanopillar arrays or flat surfaces. Scale bars represent 20 µm. D, E Quantifications of MUC1 endocytosis on (D) flat surfaces and (E) the 200-nm nanopillar arrays. MUC1_42TR-GFP shows significantly reduced endocytosis at 30 and 60 min compared to MUC1_0TR-GFP (see Supplementary Table 6A, B for the detailed statistics). F After 30-min incubation, both the triple mutation and the StcE treatment increase the endocytosis level of MUC1_42TR-GFP (see Supplementary Table 6C for the detailed statistics). Welch’s t-tests (unpaired, two-tailed, not assuming equal variance) are applied for all statistical analyses in this figure.

