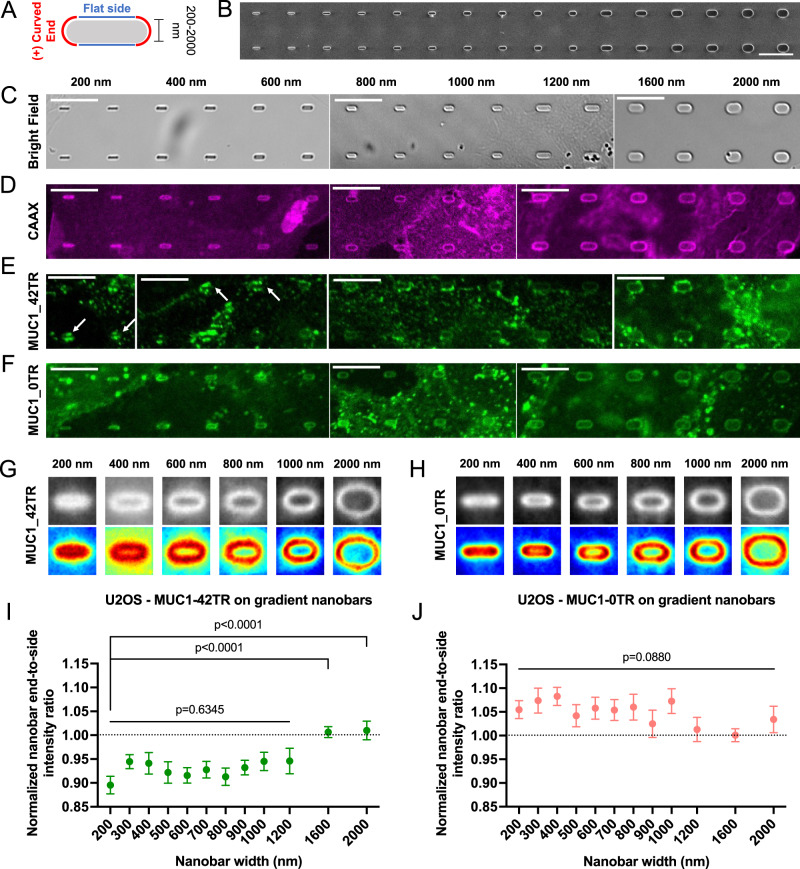
Fig. 7. MUC1’s avoidance of positively-curved membranes depends on the curvature value.
A Schematic illustration of a nanobar inducing both flat and positive curvature. B A SEM image and C bright-field images of gradient nanobar arrays with widths ranging from 200 (left) to 2000 nm (right). All nanobars are 1 µm in height and 5 µm in spacing. Nanobar width increment: 200 nm for the nanobars smaller than 1200-nm ones and 400 nm for the nanobars larger than 1200-nm ones. D–F Confocal images of U2OS cells expressing (D) mCherry-CAAX, (E) MUC1_42TR-GFP, and (F) MUC1_0TR-GFP cultured on the gradient nanobar arrays. G, H Averaged fluorescence images and heatmaps show the spatial distributions of G MUC1_42TR-GFP and H MUC1_0TR-GFP on the gradient nanobar arrays of six selected widths. I, J Quantification of I MUC1_42TR-GFP and J MUC1_0TR-GFP on the gradient nanobar arrays (see Supplementary Table 7 for the detailed statistics). All ratios are normalized against the mCherry-CAAX signals. Scale bars = 10 µm for all images in this figure. Error bars represent SEM. Both Welch’s t-tests (unpaired, two-tailed, not assuming equal variance) and one-way Welch’s ANOVA are applied for the statistical analyses in this figure.

