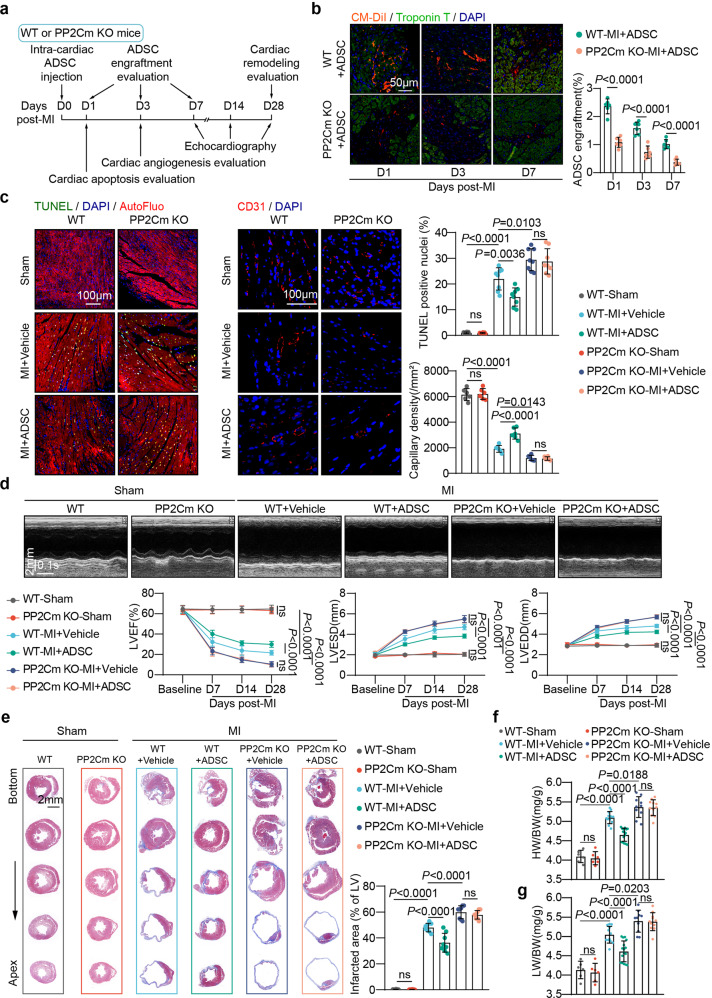
Fig. 1.
Excessive BCAA accumulation in the post-infarction heart was disadvantageous for implanted ADSC retention and cardioprotection. a Experimental scheme using WT or PP2Cm KO mice subjected to intra-cardiac ADSC injection following MI. b Left panel, representative images of CM-DiI-labeled ADSCs (red) in the peri-infarct region 1, 3, and 7 d post-MI. Troponin T staining (green) indicates cardiomyocytes. Right panel, number of engrafted ADSCs normalized to the number of cardiomyocytes. (c) Left panel, representative images of TUNEL stained cells (left) and CD31 immunostaining (middle) in the peri-infarction zone 3-d post-MI. Right panel, quantification of TUNEL and CD31 staining intensity. d Top panel, representative echocardiographic images taken 28 d post-MI. Bottom panel, LVEF, LVESD, and LVEDD values at baseline and 7, 14, and 28 d after MI. n = 6–16. e Left panel, representative images of Masson’s trichrome staining from the bottom to the apex of hearts 28 d post-MI. Right panel, quantification values of infarcted area. f HW/BW ratios 28 d post-MI. g LW/BW ratios 28 d post-MI The data are shown as the means ± SD. The engraftment rates of the ADSCs as determined by unpaired Student’s t tests. Other data were analysed by two-way ANOVAs with repeated measures followed by Bonferroni post hoc test. ADSCs adipose-derived mesenchymal stem cells, AutoFluo autofluorescence, BCAA branched chain amino acids, HW/BW heart weight/body weight ratio, LW/BW lung weight/body weight ratio, LVEF left ventricular ejection fraction, LVESD left ventricular end-systolic dimension, LVEDD left ventricular end diastolic dimension, MI myocardial infarction, PP2Cm KO mitochondrial matrix-targeted protein phosphatase 2C family member knockout, TUNEL transferase-mediated dUTP nick-end labeling, WT wild type

