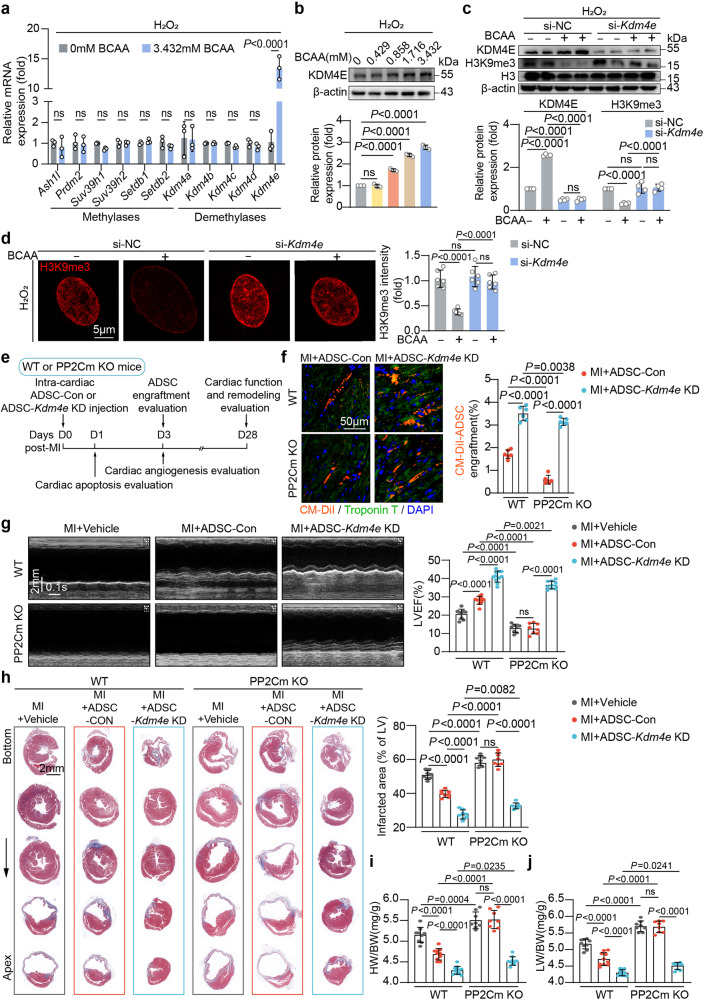
Fig. 4.
KDM4E was responsible for BCAA-associated H3K9me3 loss, adverse phenotype acquisition, and cardioprotection impairment in ADSCs. a mRNA levels of H3K9-specific methylases and demethylases in ADSCs treated with or without BCAA (3.432 mM) in the presence of hydrogen peroxide (100 μM) for 24 h. Actb was used as the endogenous control gene. b Representative western blots and quantification of KDM4E in ADSCs treated with different doses of BCAA under hydrogen peroxide (100 μM)-induced premature senescence as methods described. β-Actin was used as the loading control. c Representative blots and quantification of KDM4E, H3K9me3, H3, and β-actin in ADSCs transfected with scramble (si-NC) or Kdm4e siRNA (si-Kdm4e) and treated with or without BCAA (3.432 mM) under hydrogen peroxide (100 μM)-induced premature senescence as methods described. d Representative image and quantification of H3K9me3 intensity in ADSCs transfected with si-NC or si-Kdm4e and treated with or without BCAA (3.432 mM) under hydrogen peroxide (100 μM)-induced premature senescence as methods described. e Schematic illustration of the experiment. ADSCs labeled by the live-cell tracker CM-DiI were transfected with scramble (ADSC-Con) or siRNA specific for Kdm4E (ADSC-Kdm4e KD), and were intramyocardially injected into the WT or PP2Cm KO mice immediately after MI. f Left panel, representative images of CM-DiI-labeled ADSCs (red) in the peri-infarct region 3-d post-MI. Troponin T staining (green) indicates cardiomyocytes. Right panel, number of engrafted ADSCs normalized to the number of cardiomyocytes. g Representative echocardiographic images taken 28 d post-MI and LVEF were calculated. h Left panel, representative images of Masson’s trichrome staining from the bottom to the apex of hearts 28 d post-MI. Right panel, quantification values of infarcted area. The data are shown as the means ± SD. i HW/BW ratios 28 d post-MI. j LW/BW ratios 28 d post-MI. The data are shown as the means ± SD. The data shown in a and f were analysed by unpaired Student’s t test. The data shown in b, g, h, i, and j was analysed by one-way ANOVA followed by Bonferroni post hoc test. The data shown in c and d were analysed by two-way ANOVA followed by a Bonferroni post hoc test. ADSCs adipose tissue-derived mesenchymal stem cells, BCAA branched chain amino acids, DUX4 double homeobox protein 4, HW/BW heart weight/body weight, H3K9me3 histone H3K9 trimethylation, KDM4E lysine-specific demethylase 4E, KO knockout, LW/BW lung weight/body weight, PP2Cm mitochondrial matrix-targeted protein phosphatase 2C family member, WT wild type

