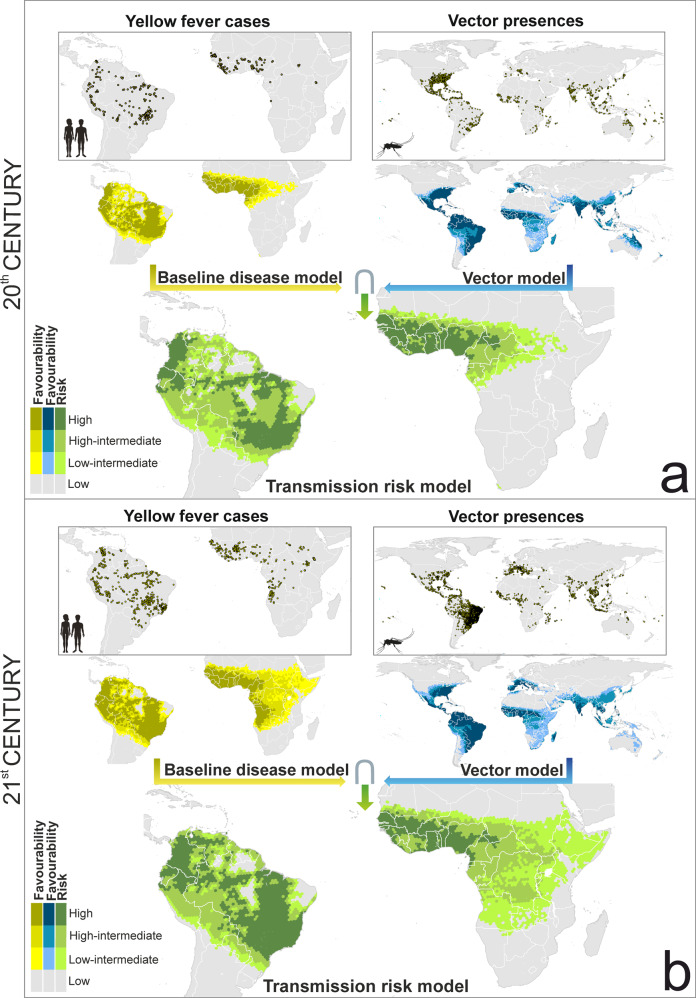
Fig. 3. Global baseline disease, vector and transmission-risk model.
a maps for the late 20th century. b maps for the early 21st century. The risk of transmission is estimated as the fuzzy intersection (∩) between favourable conditions for the occurrence of yellow fever cases, and favourable conditions for the presence of vector species. The Favourability values were considered on the following scale: High (F > 0.8); High-Intermediate (0.5 ≤ F ≤ 0.8); Low-Intermediate (0.2 ≤ F < 0.5); and Low (F < 0.2). The spatial resolution is based on 7,774-km2 hexagons. Recorded occurrences of yellow fever cases and of vector presences are also mapped (see “Yellow fever datasets” and “Vector dataset” in the Methods section for details). Mosquito and humans clip art source: http://www.freepik.com.

