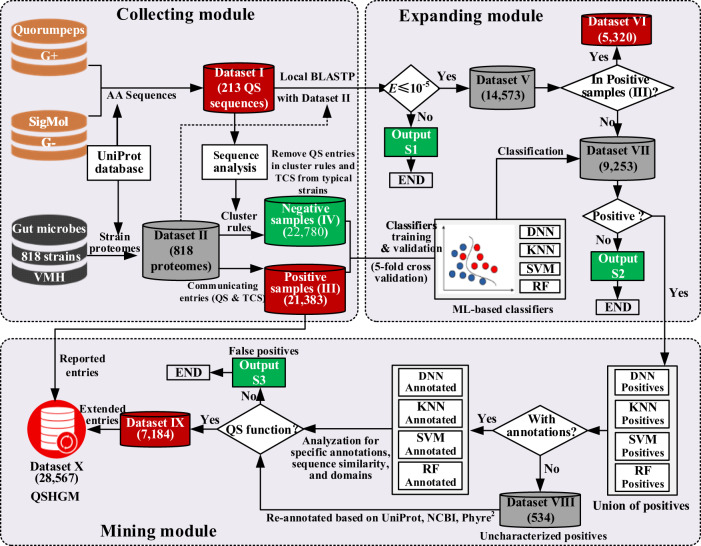
Fig. 1. Schematic diagram of the systematic workflow including three modules.
There are ten engaged datasets in our systematic workflow, i.e., 213 validated QS entries from Gram-positive (G+) and Gram-negative (G−) microbes (Dataset I) (Supplementary Data 1), 818 proteomes for the gut microbiota from VMH and UniProt (Dataset II, https://pan.baidu.com/s/1o46nn1b7L5nvCqgpwW7Zlw. Password: tfnx), positive samples collected manually from dataset I (Dataset III) (Supplementary Data 2), negative samples obtained from dataset I (Dataset IV) (Supplementary Data 3), results of local BLASTP with E ≤ 10-5 (Dataset V) (Supplementary Data 4), overlaps of the reported QS entries in dataset III and V (Dataset VI) (Supplementary Data 5), proteins dataset excluded dataset VI for dataset V (Dataset VII) (Supplementary Data 6), uncharacterized positives classified by different ML-based classifiers (Dataset VIII) (Supplementary Data 7), extended QS entries (Dataset IX) (Supplementary Data 8), and total data for QSHGM (Dataset X) (Supplementary Data 10). There are another three abandoned datasets in the workflow of the systematic workflow, i.e., protein datasets with E > 10−5 (Output S1), negative ones classified by ML-based classifiers (Output S2), and proteins without QS functions (false positives) (Output S3, Supplementary Data 9). Details of the above datasets are provided in Supplementary Table 1. Note that positive/negative/mixed datasets are colored in red/green/gray, respectively.

