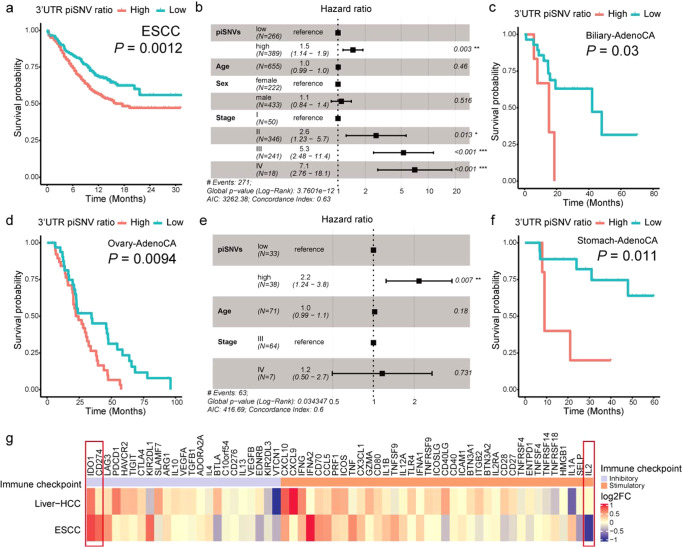
Fig. 2. Overall survival and expression of immune checkpoint genes related to the 3′-UTR piSNV ratio across cancer types.
Kaplan–Meier curves displayed overall survival of patients with high- (red) and low- (red) 3′-UTR piSNV ratio in ESCC (a), Biliary-AdenoCA (c), Ovary-AdenoCA (d), and Stomach-AdenoCA (f). Multivariate Cox regression analysis of the 3′-UTR piSNV ratio in ESCC (b) and Ovary-AdenoCA (e), which included the factors of age, gender, and TNM stage of patients. g Tumor expression difference of immune checkpoint genes between the high- and low-3′-UTR piSNV ratio groups in ESCC and Liver-HCC, fold changes were the ratios of the tumor sample in high-3′-UTR piSNV ratio group to low-3′-UTR piSNV ratio group.

