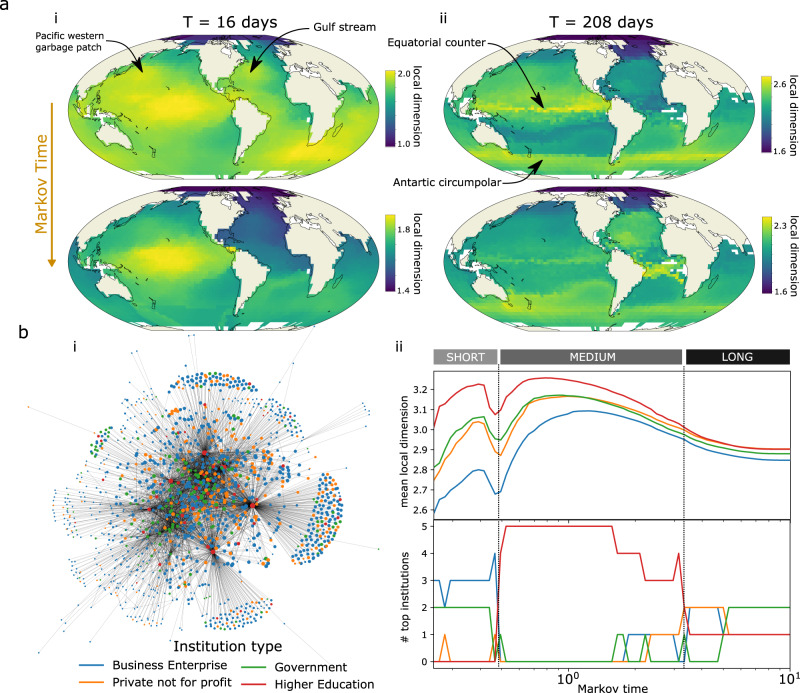
Fig. 6. Illustration of local dimension at several scales in two dataset.
In a, we considered two graphs extracted from the ocean drifter by ref. 29 where edges are the number of drifters crossing two regions of the ocean within i T = 16 and ii 208 days. For each, we selected a small and a large scale of local dimension, each representing various known features of the ocean dynamics, mostly located between the main gyres such as between the north and south equatorial in the pacific, or along the antarctic circumpolar current. In b, we explored a i social network of scientific collaborations between New Zealand institutions ii across scales, to find that the top 5 institutions are businesses at small scales, universities at longer scales, and a mix of institutions at stationarity. From middle scales, the University of Auckland remains the top-ranked node until stationarity.

