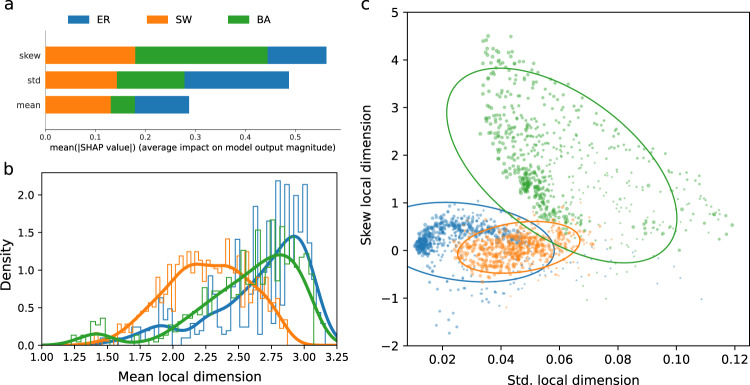
Fig. 8. Comparison of random networks (Erdos Reyni, Watts–Strogatz, Barabasi–Albert) by features derived from the distribution of local dimension (mean, standard deviation, skewness).
For each graph type, 600 graphs with varying choices of parameters was chosen (see Methods). a The shap value for each feature reveals the importance of each feature in distinguishing random graph types in the trained random forest model. b A density histogram revealing the distribution of the mean local dimension of each random graph type. c Each graph is plotted by their skewness and standard deviation of local dimension, coloured by the random graph type and marker size is proportional to the number of nodes. The ellipses indicate a 2 standard deviation confidence interval using a Pearson correlation for each graph type.

