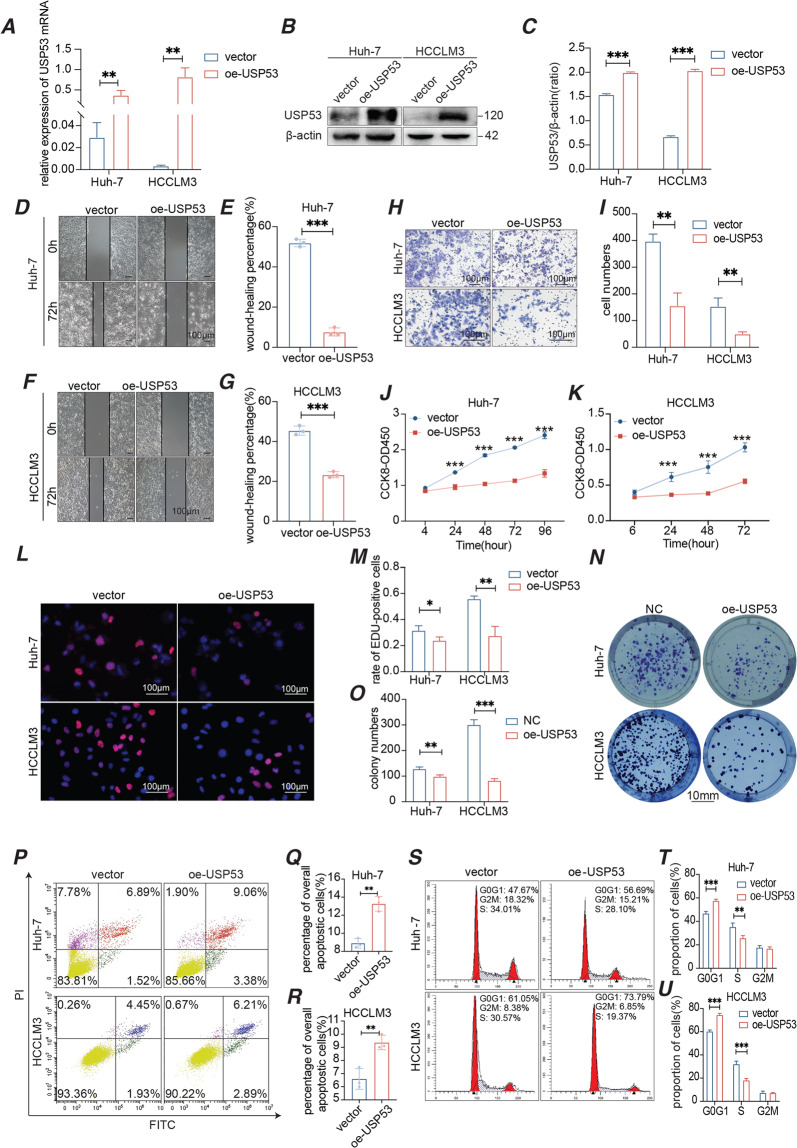
Fig. 2. Overexpression of USP53 inhibited the growth of HCC cells in vitro.
A–C USP53 mRNA and protein levels in Huh-7 and HCCLM3 cell lines in which USP53 overexpression plasmid was suitably transfected. D–G Representative images of the wound-healing assay showing migration distance of the control and USP53-overexpressing cells. Magnification 100x. Scale bar:100 μm. The wound-healing percentage was calculated by the distance changes between the two sides. H, I Representative images of the trans-well assay showing invasion capacity of control and USP53-overexpressing cells. Scale bar:100 μm. J, K Percentage of the proliferating cells in the indicated groups. There were 2000 cells per group initially. n = 6. L, M Representative images showing EdU uptake in the control and USP53-overexpressing Huh-7 and HCCLM3 cells. EdU was marked by red fluorescent dyes. DAPI which stained the nucleus showed the blue fluorescence. Magnification 400x. Scale bar:100 μm. N, O Number of colonies formed by the control and USP53-overexpressing Huh-7 and HCCLM3 cells. Scale bar: 10 mm. P–R Flow cytometry plots showing percentage of apoptotic control and USP53-overexpressing Huh-7 and HCCLM3 cells. The cells were marked by annexin V. S–U Flow cytometry plots showing the cell cycle distribution of control and USP53-overexpressing Huh-7 and HCCLM3 cells. All experiments were repeated three times. *p < 0.05; **p < 0.01; ***p < 0.001.

