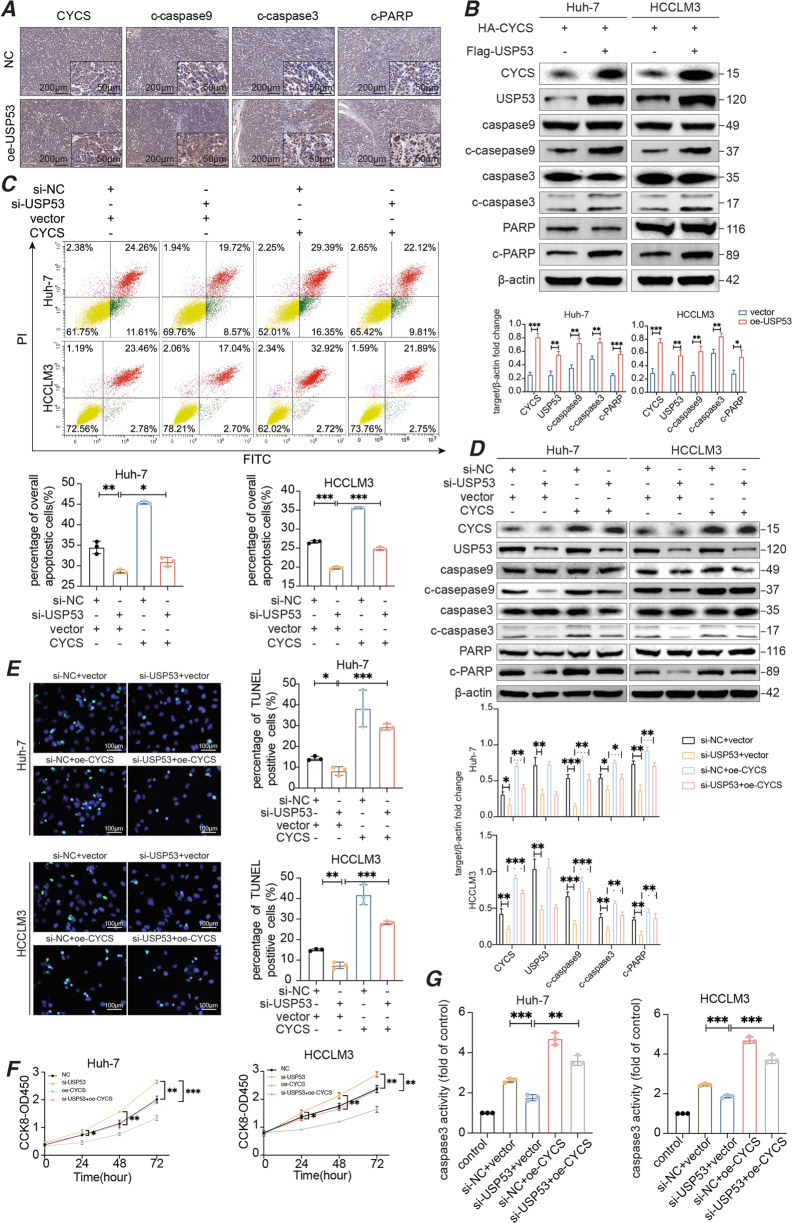
Fig. 6. USP53 induced apoptosis via deubiquitination of CYCS.
A Immunohistochemical staining of CYCS, c-caspase-9, c-caspase-3, c-PARP in xenograft tumors from the USP53 overexpression and control group. (magnification 100x and 400x). B Immunoblot showing the expression of apoptosis-related proteins in the indicated groups. C Flow cytometry plots showing the apoptotic rates in HCC cells co-transfected with si-USP53 and HA-CYCS or control. n = 3. D Immunoblot showing the expression of apoptosis-related proteins in CYCS-overexpressing and USP53-knockdown cells. E Representative images showing TUNEL + cells after CYCS overexpression and USP53 knockdown. Magnification: 400x. Scale bar:100 μm. F CCK8 assay revealed proliferation capacity of the indicated groups. G Caspase-3 activity of the indicated groups of Huh-7 and HCCLM3 cells. Data are described with means ± SD of the three independent experiments. Each value is expressed as the fold of caspase-3 activation level to the control level, and the value of control was set to 1. All experiments were repeated three times. *p < 0.05; **p < 0.01; ***p < 0.001.

