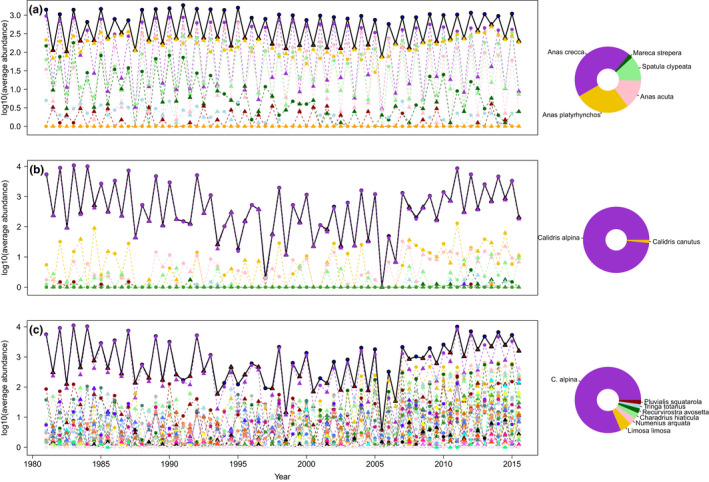
FIGURE 1.

Time series of seasonally averaged abundance for ducks of the tribe Anatini (a), calidrids (b, Calidris genus), and all waders (c, including calidrids). The solid black lines (on top of each panel) represent the summed average abundances for each guild, dotted lines represent average abundance for each species. Circles represent the cold season and triangles, the warm season. The colored symbols below the curves represent each species abundances, with species composition on the right side on the donut plots for the most abundant species (over 1% of relative abundance in the group considered). We added 1 to abundances before log‐transforming to avoid issues with zero values
