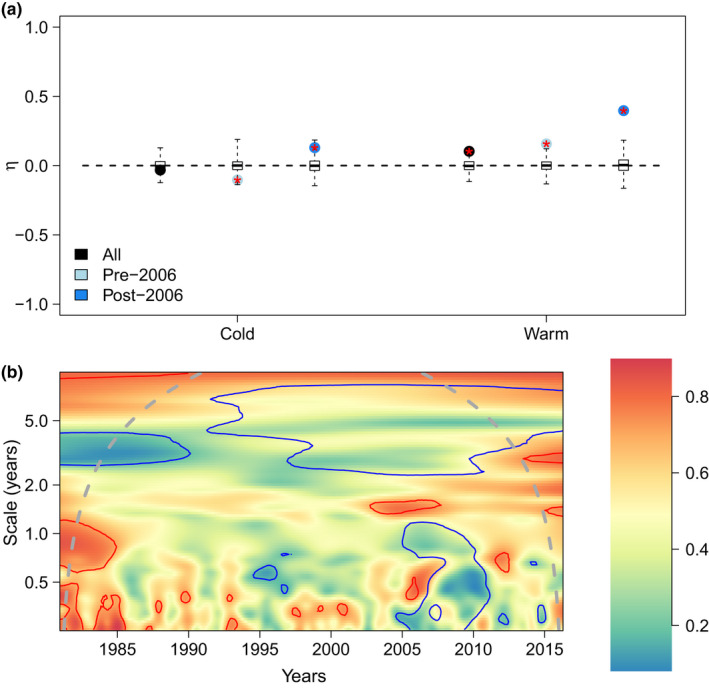
FIGURE 3.

Synchrony indices for the whole community of frequently observed birds. Panel (a) presents yearly synchrony (η) for both seasons and (b) the wavelet modulus ratio (ρ). The latter index scales from 0 (compensation, blue color) to 1 (synchrony, red color). Blue and red lines respectively delineate regions of significantly lower and higher synchrony than the null model (independently fluctuating species, but conserving their original Fourier spectrum), at the 10% level
