
Fig. 1. Differential therapeutic effects of αPD-L1 and/or polyIC on subcutaneous and liver tumors.
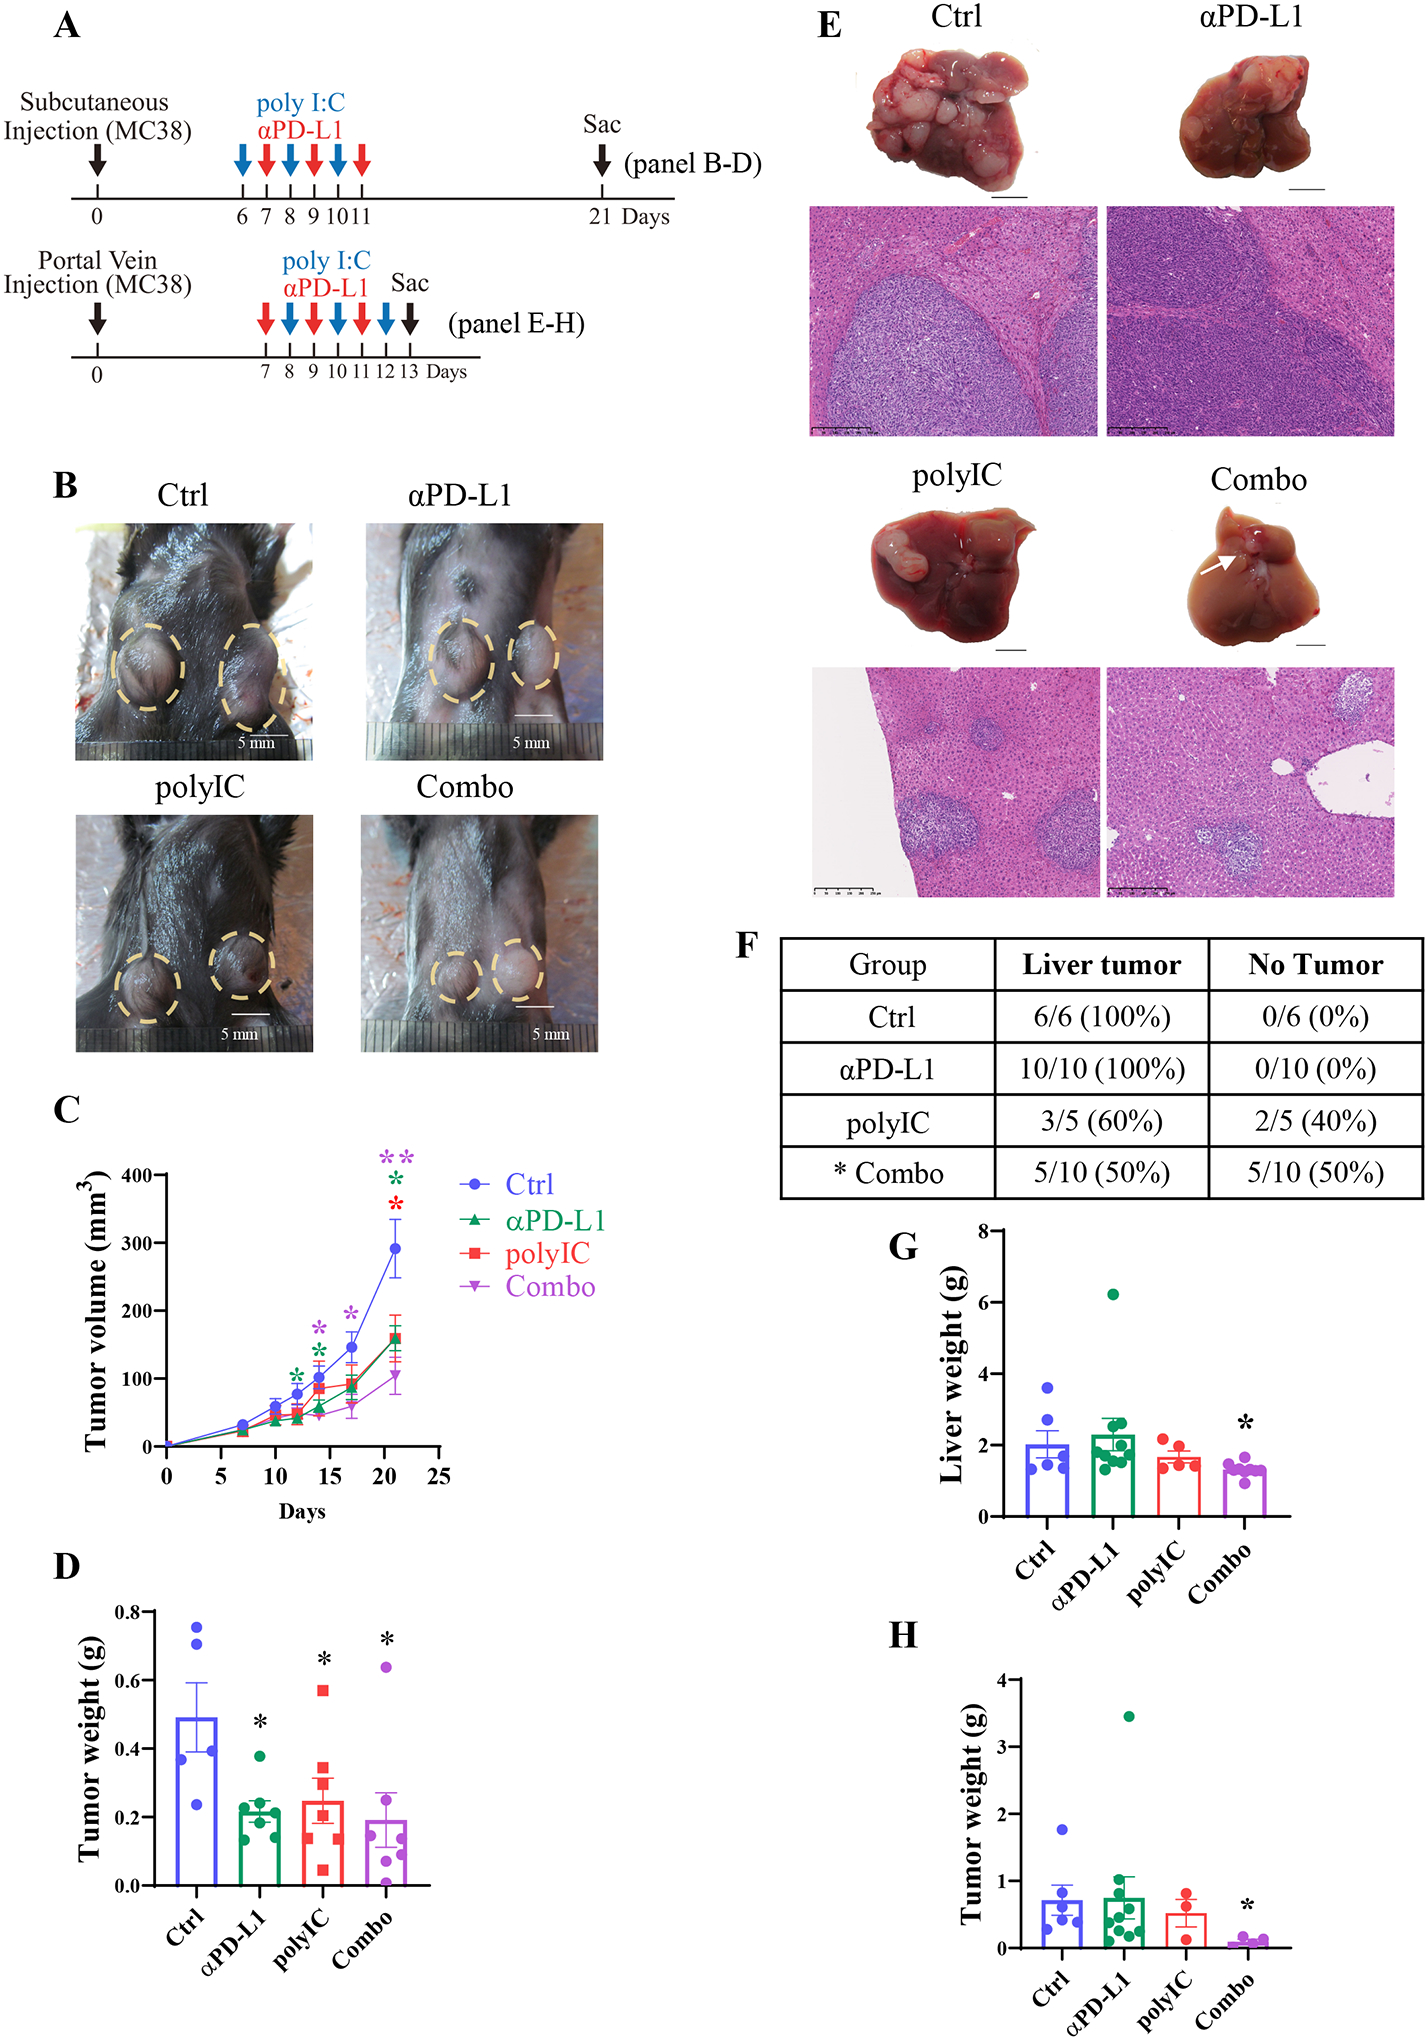
A). Upper panel: the experimental scheme of the subcutaneous tumor model with relevant data in 1B-D. After MC38 cell inoculation, polyIC was injected intraperitoneally (i.p.) at day 6, 8 and 10, αPD-L1 injected at day 7, 9, and 11. The Combo group received both at these time points. Lower panel: the scheme of the liver-grafted tumor model with data shown in 1E-H. After portal vein injection of MC38 cells, polyIC was injected at day 8, 10, and 12, αPD-L1 injected at day 7, 9, and 11, and the Combo group received both.
B). Macroscopic views of representative subcutaneous tumors of untreated (Ctrl), treated with polyIC, αPD-L1, or the combination (Combo). A yellow dotted circle indicates the tumors.
C). The subcutaneous tumor volumes were measured at various time points, n = 5–8.
D). Subcutaneous tumor weights of each group. Samples were collected at day 21 after tumor cell inoculation, n = 5–7.
E). Macroscopic views of representative tumors, and H&E staining of liver sections for each group on day 13.
F). The liver tumor formation rates of each group. Statistical analysis: Chi-square test, * p < 0.05.
G). Liver weights of each group, n = 5–10.
H). Tumor weights of each group, n = 4–10.
Statistical analysis: One-way ANOVA or Kruskal-Wallis, compared with Ctrl. * p<0.05, **p<0.01.