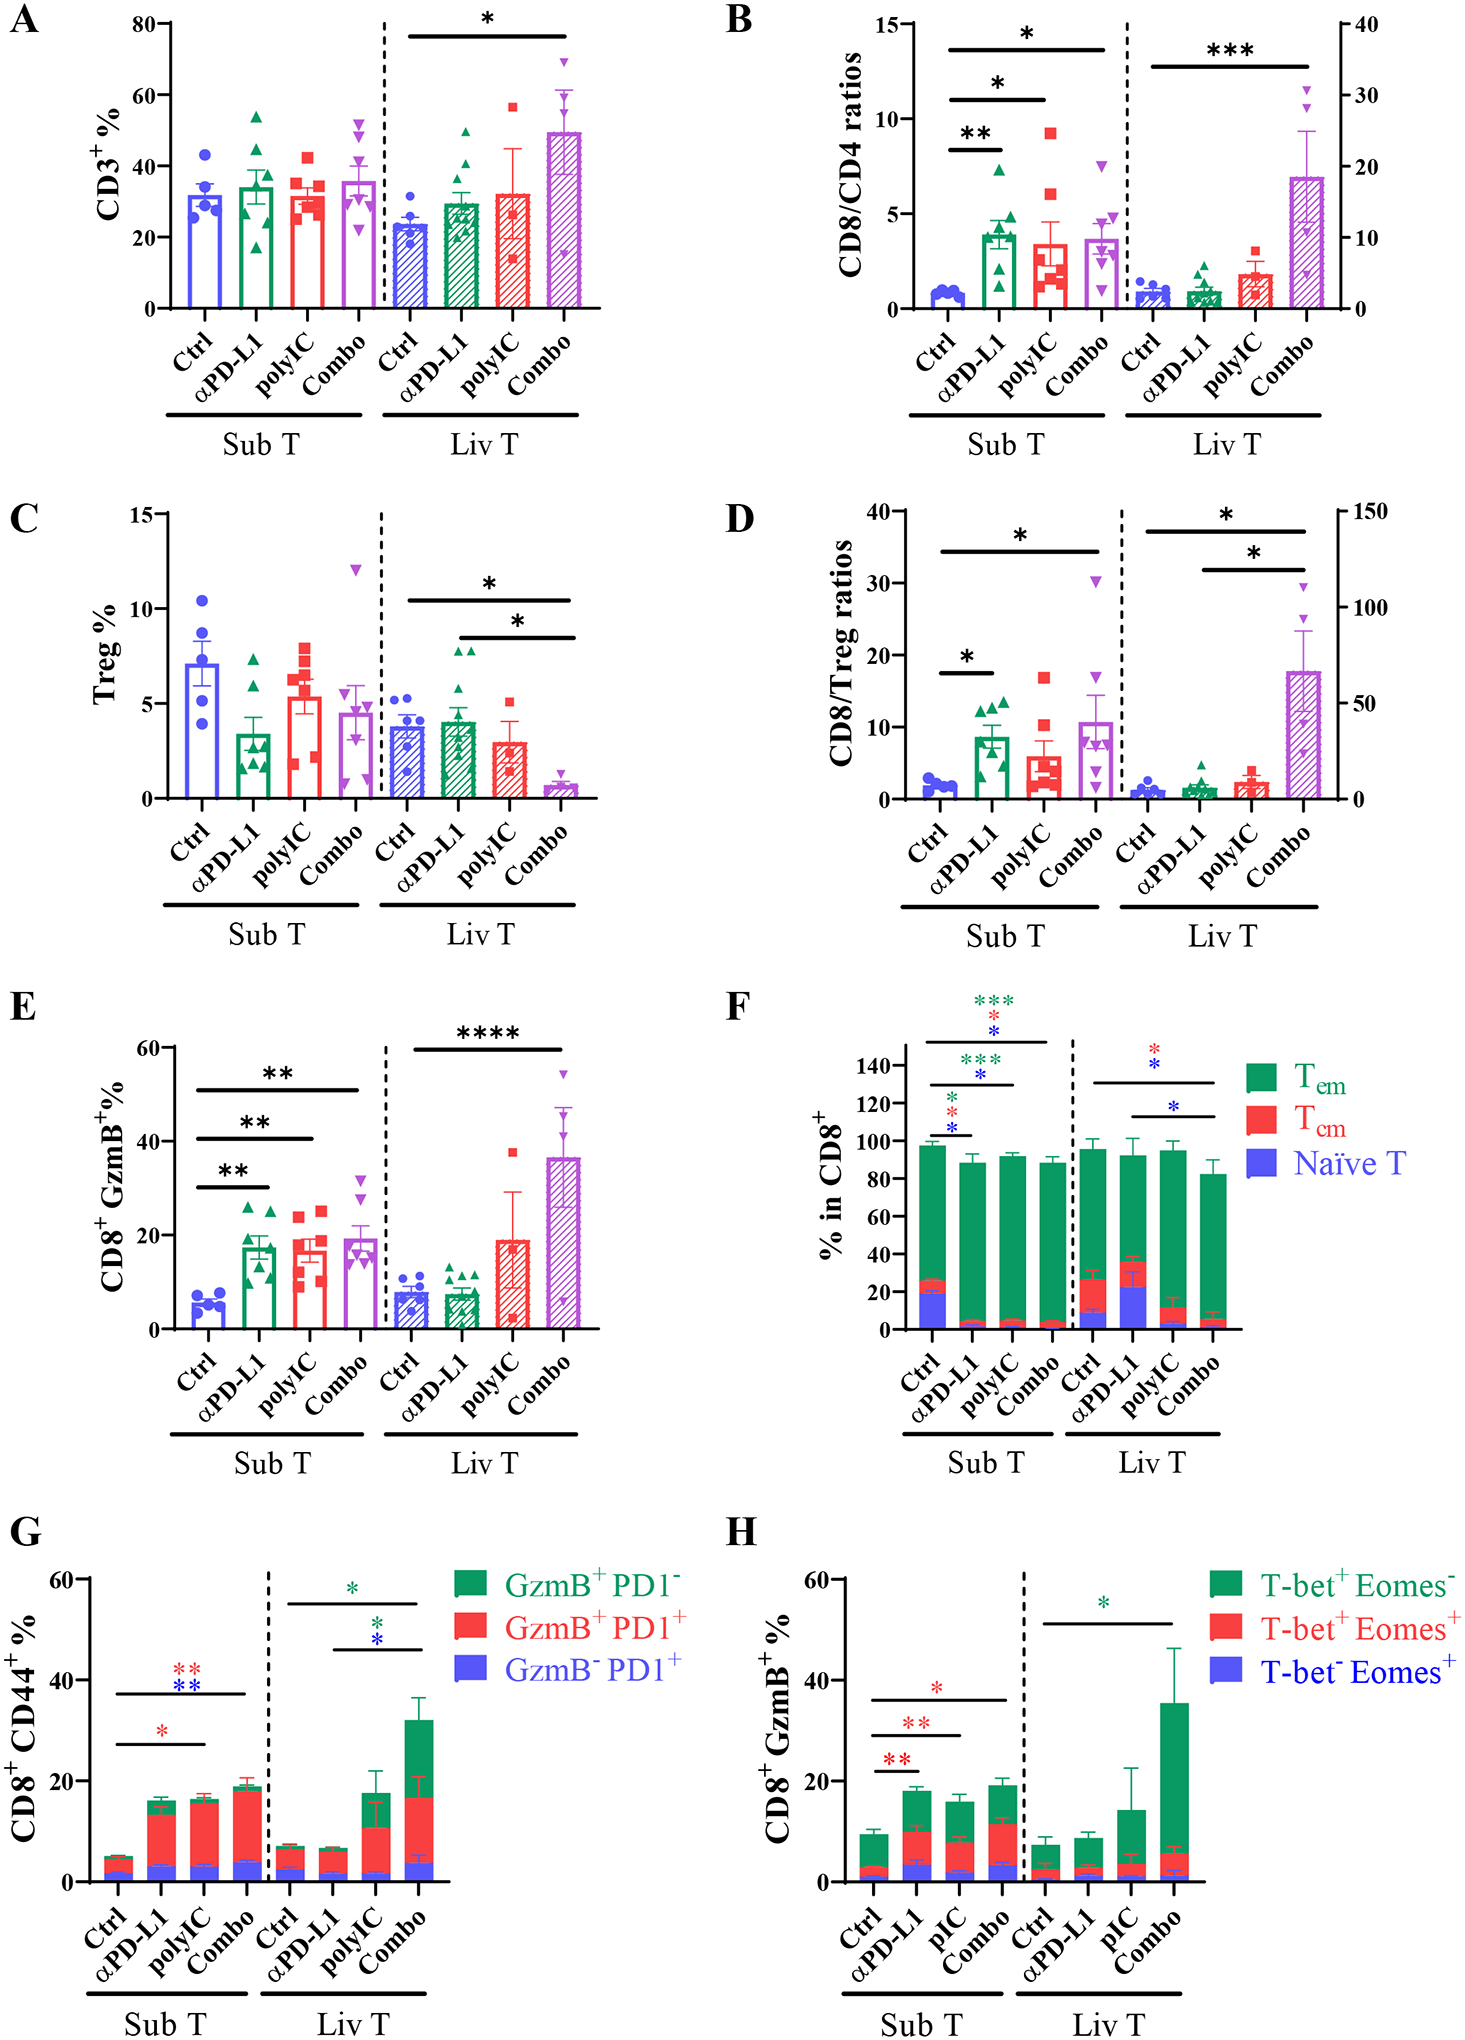
Fig. 2. The immune cell profiles in subcutaneous and liver tumors.

A). The percentages (%) of CD3+ cells (CD45+ L/D− CD3+ NK1.1−) in CD45+ cells, in subcutaneous tumors (Sub T, left to dotted line) or metastasized liver tumors (Liv T, right to dotted line). The numbers of total CD45+ cells in each gram of tumor tissues were first determined and the relative percentages or ratios of various cell types were calculated.
B). The CD8 versus CD4 T cell ratios.
C). The percentages of Treg cells (CD3+ NK1.1+ CD4+ Foxp3+) in CD45+ cells.
D). The CD8 to Treg cell ratios.
E). The percentages of CD8+ GzmB+ T cells (CD3+ NK1.1+ CD8+ Granzyme B+) in CD45 cells.
F). The percentages of indicated cell subsets in CD8 T cells. Green bar: effector memory T cell (Tem, CD62L−CD44+); blue bar: naïve T cells (CD62L+CD44−); red bar, central memory T cells (Tcm, CD62L+CD44+). Asterisks in each color represent the p values.
G). The percentages of Tem cells of Granzyme B or PD1 expression in total CD45 cells. Blue bar: exhausted Tem (GzmB− PD1+); red bar, Tem cells that are GzmB+ and PD1+; green Bar: functional Tem cells (GzmB+PD1−) without the feature of exhaustion. Asterisks in each color represent the p values.
H). The percentages of CD8+GzmB+ T cells distinguished by T-bet and Eomes expression in total CD45 cells. Green bar: effector CD8 (T-bet+Eomes−); red bar: intermediate state of activated CD8 cells (T-bet+Eomes+); blue bar: memory CD8 cells (T-bet−Eomes+); Asterisks in each color represent the p values. n = 4–10.
Tumor samples of Sub T and Liv T were collected from 3 individual experiments. Statistical analysis: one-way ANOVA or Kruskal-Wallis. * p<0.05, **p<0.01.
