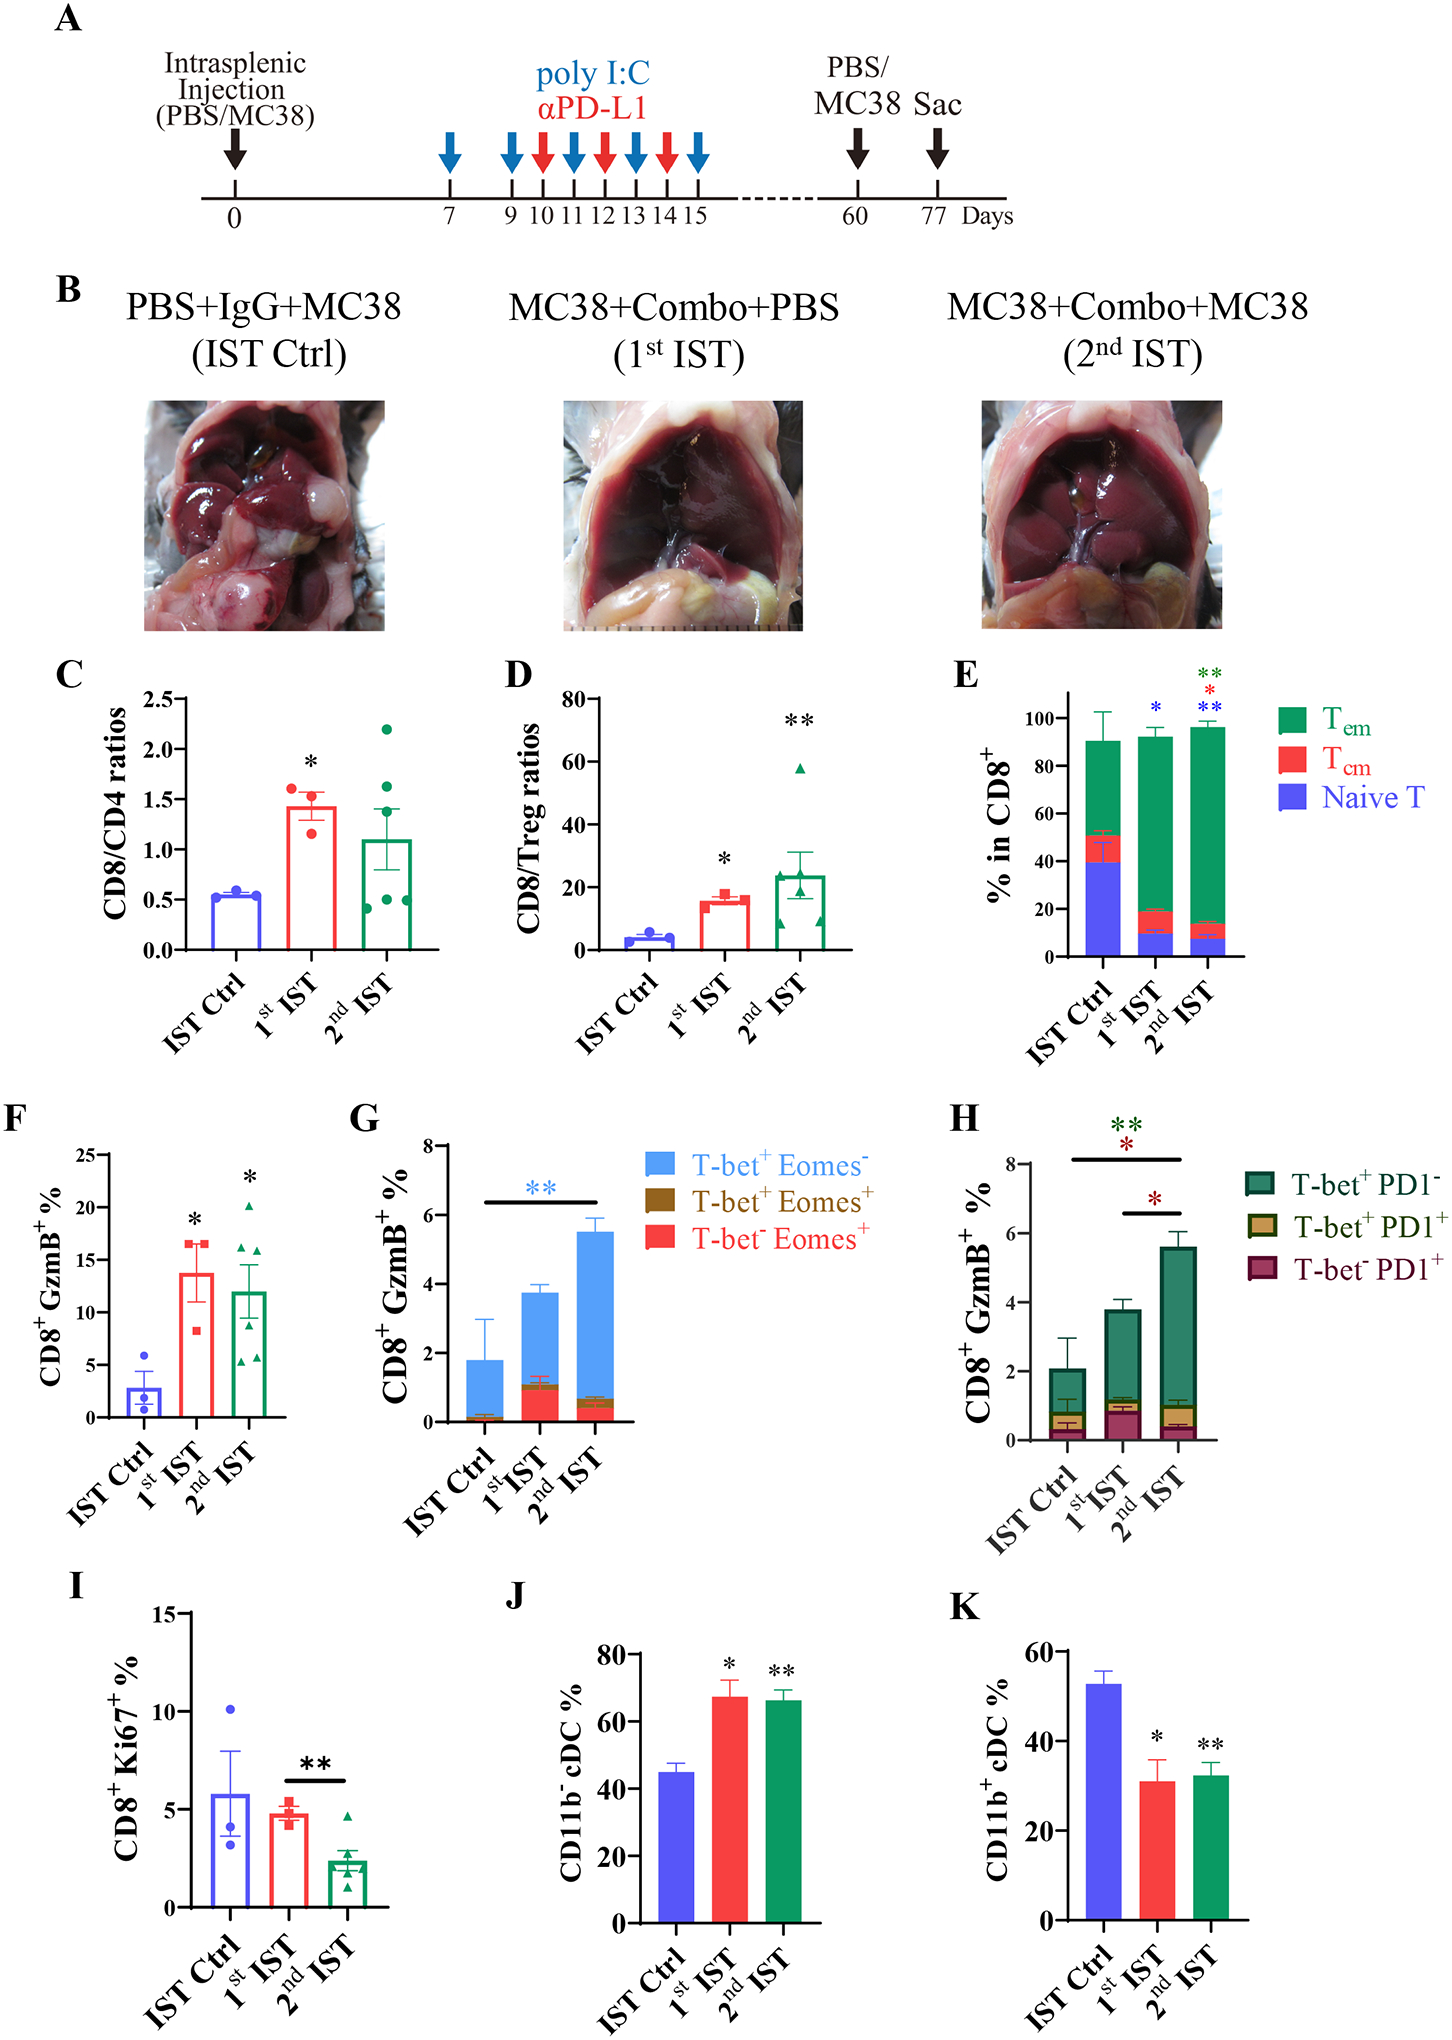
Fig. 5. The preventive effect of liver tumor recurrence by the Combo treatment.

A). The scheme of the tumor recurrence model. Mice received the first intrasplenic injection of MC38 cells and were treated with polyIC and αPD-L1 as indicated. At 60 days after the 1st tumor cell inoculation (1st IST), tumor-free mice received the 2nd injection of MC38 cells (2nd IST). A control group of mice (IST Ctrl) received PBS at day 0, and were injected with tumor cells at 60 days. All mice were sacrificed at day 77 for analysis.
B). Representative macroscopic view of the livers in each group on day 77.
C-D). The ratios of CD8 to CD4 (C) and CD8 to Treg cells (D).
E). The subsets of CD8+ T cells on day 77. Green bar: effector memory T cells (Tem, CD62L−CD44+); red bar: central memory T cells (Tcm, CD62L+CD44+); blue bar: naïve T cells (CD62L+ CD44−).
F). The percentages of CD8+ GzmB+ T cells in total CD45 cells.
G). The expression of T-bet and Eomes in the CD8+ GzmB+ subset of the indicated groups. Water blue bar: effector CD8 (T-bet+ Eomes−); brown bar: intermediate state of activated CD8 cells (T-bet+Eomes+); red bar: memory CD8 cells (T-bet−Eomes+). Asterisks in colors represent the p values.
H). The expression of T-bet and PD1 in the CD8+ GzmB+ T cells. Green bar: effector CD8 (T-bet+ PD1−); yellow bar: the effector cells with exhausted feature (T-bet+PD1+); red bar: exhausted CD8 T cells (T-bet−PD1+).
I). The proliferation rates of CD8+ T cells based on Ki67 staining.
J-K). The relative percentages of CD11b− cDCs (J) and CD11b+ cDCs (K).
IST Ctrl: n = 3, 1st IST: n = 3, 2nd IST: n = 6. Statistical analysis: One-way ANOVA or Kruskal-Wallis, compared with Ctrl (asterisk only) or the line of the compared groups indicated on the top of the graph. * p<0.05, **p<0.01.
