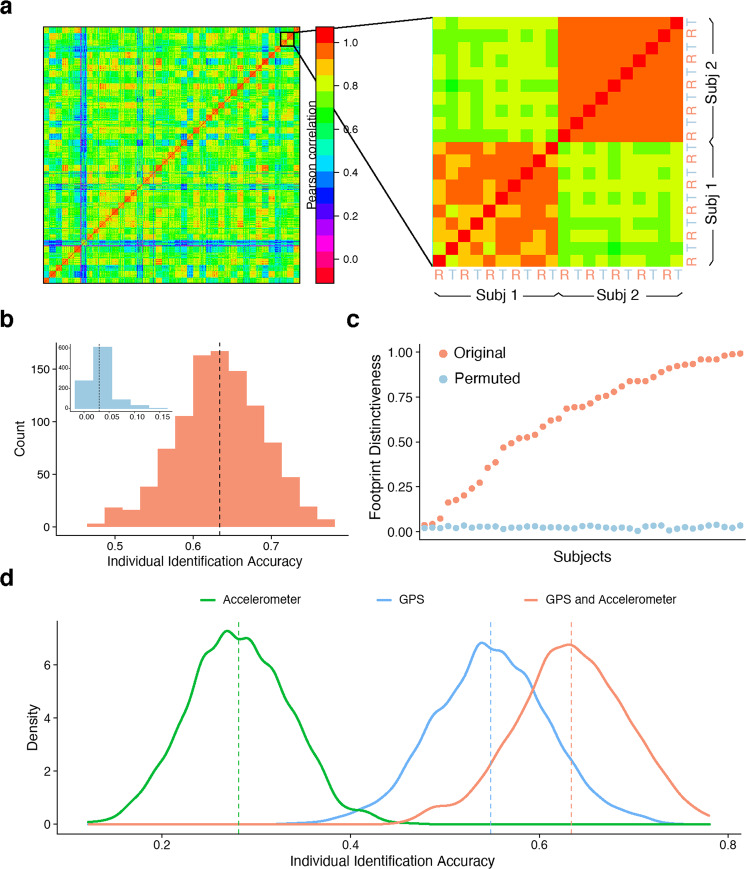
Fig. 2. Identifying individuals using personal footprints.
a As an initial step, we visualized the similarity of mobility features across multiple random reference and target partitions (R & T in inset). Mobility features were more correlated within participants (on-diagonal) across data partitions than between participants (off-diagonal). Note that this visualization was not used in statistical analysis or individual identification. b Across 1000 random partitions, mobility footprinting enabled successful individual identification (mean: 63%, S.D.: 6%). In contrast, the mean chance accuracy from 1000 permutation was 3% (inset, p < 0.001). The dotted line indicates the average individual identification accuracy across random data partitions. c For each individual, we calculated the footprint distinctiveness, or the percentage of correct identification across the 1000 random partitions of the data. Ranked in ascending order, participants’ footprint distinctiveness exhibited a wide range, from 4% to 99%. However, even the participant with the lowest footprint distinctiveness was significantly higher than the null distribution (2%). d Individual identification based on geolocation alone had higher accuracy than accelerometer alone (p < 2.2 × 10⁻¹⁶). However, they appeared to encode complementary features, as performance was maximal when both measures were used in footprinting (p < 2.2 × 10⁻¹⁶). The dotted line indicates the average individual identification accuracy across random data partitions.

