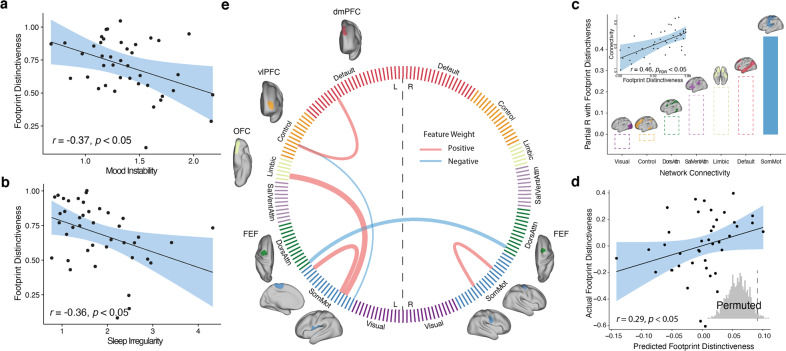
Fig. 3. Individual footprint distinctiveness is associated with affective instability, sleep irregularity, and patterns of brain functional connectivity.
a Greater affective instability, measured by root mean square of successive differences in mood measures from ecological momentary assessment performed three times a day, was associated with reduced footprint distinctiveness (r = −0.37, p < 0.05), after controlling for data quantity, age, sex, and mean level of mood ratings. b Similarly, we found that increased variability in sleep duration was associated with reduced footprint distinctiveness (r = −0.36, p < 0.05), after controlling for covariates. c Across functional brain networks, greater connectivity within the somatomotor network had a significant association with footprint distinctiveness (r = 0.46, p < 0.05, corrected for multiple comparisons with the false discovery rate). d Patterns of brain functional connectivity significantly predicted individual footprint distinctiveness using leave-one-out cross-validation (r = 0.29, inset: permutation-based p = 0.025). e Six network edges consistently contributed to the sparse regression model. These edges included greater connectivity within somatomotor network, reduced connectivity between left and right frontal eye fields (FEF), increased connectivity between the somatomotor network and the left orbital frontal cortex (OFC) in the limbic network, as well as increased connectivity between the ventrolateral prefrontal cortex (vlPFC) in the frontoparietal network and the dorsomedial prefrontal cortex (dmPFC) in the default mode network. Cord thickness reflects the weights in the model, reflecting each edge’s contribution to the prediction; cord color indicates the sign of the weights.

