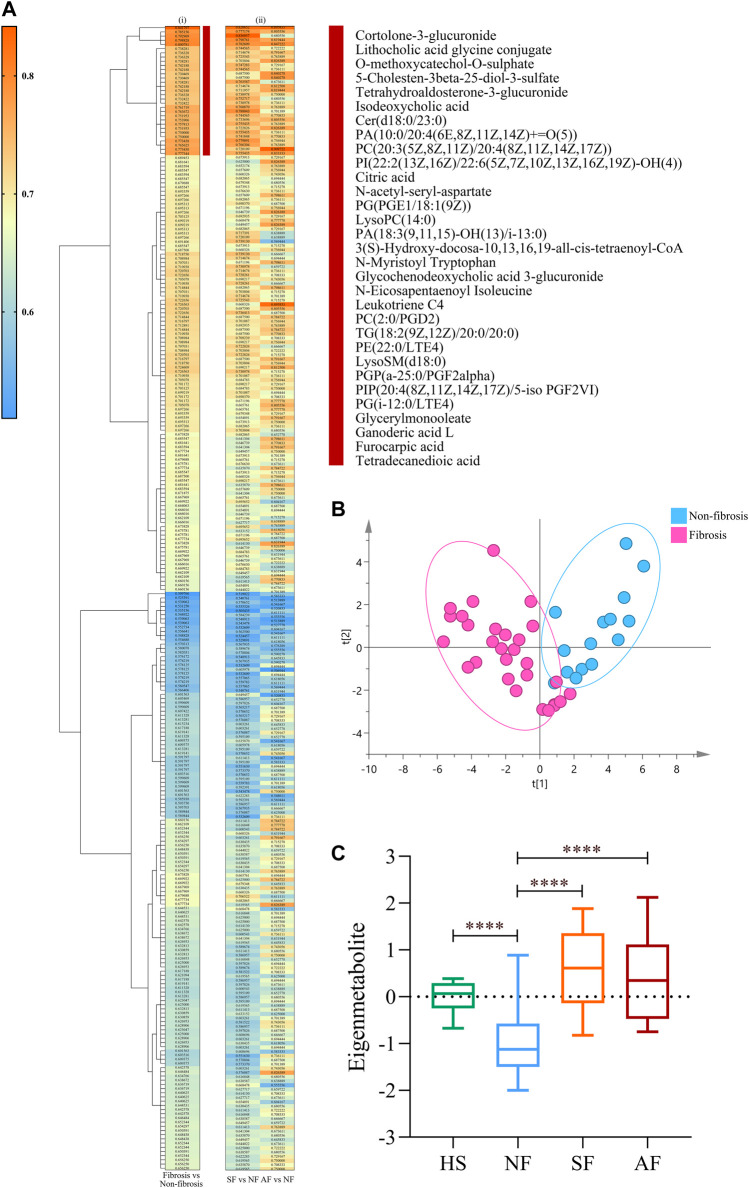
FIGURE 2.
Identification of fibrosis-related metabolite fingerprint. (Ai) Hierarchical cluster analysis of the area under the receiver operating characteristic curve (AUC) and p-value differentiation between fibrosis (SF + AF) and nonsignificant fibrosis groups. Vertical brownish-red bar identified the 31-metabolite cluster, which acted as the fibrosis-associated metabolite fingerprint. (Aii) Corresponding metabolite AUC and p-value in accessing the SF or AF groups relative to fibrosis. (B) Principal component analysis of the fibrosis metabolite fingerprint between fibrosis and nonsignificant fibrosis DILI patients. (C) Change of the fibrosis eigenmetabolite in patients with different stages of fibrosis progression. Data are presented as mean ± SD. ****p < 0.0001, compared with the NF group. HS, healthy subjects; NF, nonsignificant fibrosis; SF, significant fibrosis; AF, advanced fibrosis.

