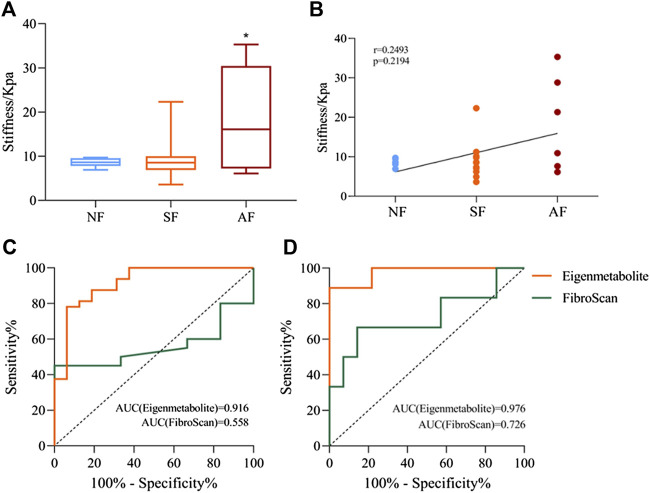
FIGURE 6.
Comparison of metabolite fingerprints and FibroScan in the identification of liver fibrosis grade. (A) Liver stiffness values measured by FibroScan in NF, SF, and AF groups. (B) Spearman’s correlation analysis between liver stiffness and fibrosis grade, with the r and p values indicated. (C) Receiver operating characteristic (ROC) curves of metabolite fingerprint (eigenmetabolite) and FibroScan for the diagnosis of fibrosis and nonsignificant fibrosis patients with chronic DILI. (D) ROC curves of the metabolite fingerprint (eigenmetabolite) and FibroScan for the diagnosis of advanced fibrosis from significant patients with chronic DILI. Data are presented as mean ± SD. *p < 0.05, compared with the NF group. NF, nonsignificant fibrosis; SF, significant fibrosis; AF, advanced fibrosis.

